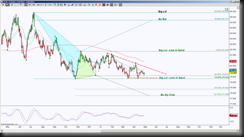
The day chart shows price is constricting inside a descending triangle. This triangle support correlates with a line in the sand for two opposing emerging harmonic patterns at 79.325. All markets, all instruments go through the cycles of contraction and expansion, similar to breathing, so that when price is contracting it’s like having shallow breathing or holding your breath. The longer you hold your breath the more forceful the exhaling is, or expansion. So this implies the longer price coils, the larger the move can be. And the closer price gets to the apex of a triangle, the harder it is to hold it.
 This day chart shows the pretty triangles representing the harmonic patterns, with completion targets in opposite directions. If price breaches 79.325 even slightly, it invalidates the opposing pattern, in this case colored cyan. A hold below 79.325, meaning price fails to push back and have closing candles or bars above 79.325, increases the probability of completing the green pattern at 77.768.
As long as 79.325 is not tested or if tested, not breached, then both patterns remain in play. A break out of the triangle increases the probability of testing 81.845, above there invalidates the green pattern and focuses on completion of the cyan pattern at the 84.707 target.
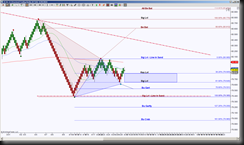
Looking at an intraday perspective, in this case, an STRenko 20 bar size chart, shows what is occurring inside that triangle.
 This chart is also in between opposing patterns, this is typical when price is in consolidation, and currently price is holding above GRZ level 79.805, the initial upside target is 80.065, above there invalidates the blue pattern and a hold above 80.065 increases the probability of testing the daily triangle resistance line. A completion of the brown pattern at 80.612 will help price breach the triangle, then the key will be if can hold above it or continue to seek the 80.950 extended target.
If price holds back below GRZ 79.805, then the initial support test target is 79.45, below there has a completion target at 79.531. If the blue bullish Gartley is a valid reversal pattern, it could prevent price from testing the triangle support line at this time, but if price pushes below 79.531, there’s increased probability of testing that triangle support line. A break down there has harmonic completion targets which will help push price below the triangle.
