
Tag Archives: TF_F
Premarket and End of Day Harmonic Trading Charts 9/6/13
Gallery
This gallery contains 28 photos.
The end of day charts are the preliminary harmonic analysis for globex and following day’s premarket setups
Premarket and End of Day Harmonic Trading Charts 9/5/13
Gallery
This gallery contains 30 photos.
The end of day charts are the preliminary harmonic analysis for globex and tomorrow’s premarket
Premarket and End of Day Harmonic Trading Charts for 9/3/13
Gallery
This gallery contains 26 photos.
The end of day charts are the preliminary harmonic analysis for globex and tomorrow’s premarket
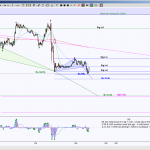
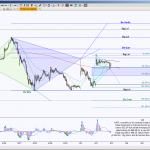
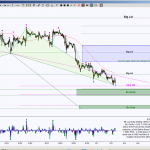
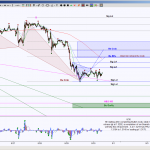
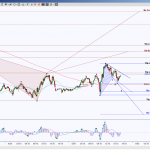
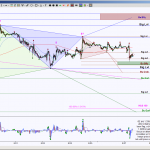
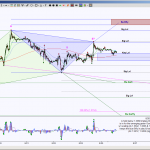
Premium Members Harmonic Trading Charts for DX_F and TF_F
Gallery
DX_F bigger picture (day chart) shows price is testing GRZ (Golden Ratio Zone) in the middle of wedge that began a year ago. The last attempt to test the wedge support in Jun 2013 fell short of the target, buyers … Continue reading
Corrected Premarket and End of Day Harmonic Trading Charts 8/30/13
Gallery
This gallery contains 42 photos.
The end of day charts are the preliminary harmonic analysis for globex and tomorrow’s premarket
Premarket and End of Day Harmonic Trading Charts 8/29/13
Gallery
This gallery contains 28 photos.
The end of day charts are the preliminary harmonic analysis for globex and tomorrow’s premarket
Premarket and End of Day Harmonic Trading Charts 8/27/13
Gallery
This gallery contains 28 photos.
The end of day charts are the preliminary harmonic analysis for globex and tomorrow’s premarket
Premarket and End of Day Harmonic Trading Charts 8/26/13
Gallery
This gallery contains 28 photos.
The end of day charts are the preliminary harmonic analysis for globex and tomorrow’s premarket