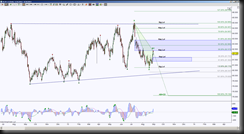
DX_F bigger picture (day chart) shows price is testing GRZ (Golden Ratio Zone) in the middle of wedge that began a year ago. The last attempt to test the wedge support in Jun 2013 fell short of the target, buyers stepped in to extend the top of the wedge. What does this mean? It means that the range extremes are slightly upward bias, making higher lows which fail to test the support line and slightly higher highs.
Look at the daily chart below, using the most recent impulsive move from 84.965 high to 80.770 low, price is seeking a harmonic leg (AB) that requires minimum target at 82.372. A rejection of this region has ideal minimum
fall back target to small GRZ 81.731. Failure to pullback to at least 81.731 implies price still seeking a B point and has the green Fibonacci ratios as potential B point targets. Because it’s always a good idea to be prepared for multiple scenarios, what happens if price goes below A point at 80.770? Well, of course the wedge support line will be first important support test, but a break down there has AB=CD target 78.130.
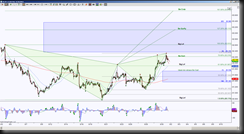
Now let’s look at the intraday hourly chart. Price has completed a bearish Gartley, a strong harmonic pattern likes to retrace 88.6 to 100% or more, but I always seek the ideal minimum retracement target first, in this case, that target is 81.730 … whether price can get there tells as story … how price behaves at this level also tells a story.
So how to trade this? Well, Friday’s candle shows indecision after attempting to test the GRZ 82.372. A red dot derived from ATR implies this move is complete, this has correlation of a red dot on intraday chart, however price is also in small bull flag type consolidation, so conservative long opportunity is to wait for a close & test above the small channel for long opportunity with initial scaling point at 82.216, a hold above there has ideal target 83.747 but important scaling points along the way at 82.325, 82.610, 83.110 and 83.365. Or an aggressive short opportunity with a rejection of top of channel, or a conservative short opportunity with a close and hold below 81.907, with ideal target being 80.770 (remember we want to see if can retrace 100%) and scaling points at 81.730, 81.548, 81.365, 81.103 & 80.947.
********************************************************************************************************
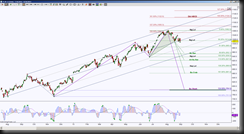
TF_F bigger picture (day chart) shows price attempting to hold below both GRZ 1014.6 and Pitchfork midline. So far the downside breaches of the midline have found support at the 25% Pitchfork line. There is harmonic motivation to complete patterns with a break down of 1014.6.
Note the completion of the Bullish Bat at 952.1 will help price test the Pitchfork support line, there is a potential breach of 952.1 to test either 938 or 921.9 then bounce into the break down point 952.1 to test for resistance, this will be important of price holds above or below this line if the Bat or Alternate Bat completes. A hold below 921.9 has ideal target 784.2 with scaling points 890.6 & 861.4. A hold above 1014.6 suggests price will have sideways bias up to 1062, above there has ideal target at double bearish ABCD target 1124.7 and scaling point at 1083.3.
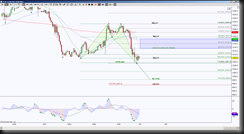
Not let’s look at the intraday chart for clues as to intermediate targets and scenarios.
Hour chart price has completed an Alternate Bullish Bat at 1007.2, currently stalling and indecisive as to hold above or below 1010. A hold above 1010 has initial resistance at 1012.2 but above there has 1015.5 target, this is key level, failure to get there or a rejection there keeps overall downside bias, especially if can break down 1007.2, below there has ideal target 998.3 with scaling point 1002.8. Potential breach of 998.3 to test AB=CD at 995.3. Now if price is able to get above 1015.5, this has ideal retracement target at 1028.9 for a 100% retracement of Alternate Bullish Bat with scaling points 1018.1, 1021.7, 1024.3 & 1026.4.


