This gallery contains 28 photos.
The end of day charts are the preliminary harmonic analysis for globex and following day’s premarket setups


This gallery contains 28 photos.
The end of day charts are the preliminary harmonic analysis for globex and following day’s premarket setups
This gallery contains 36 photos.
The end of day charts are the preliminary harmonic analysis for globex and following day’s premarket setups
This gallery contains 26 photos.
The end of day charts are the preliminary harmonic analysis for globex and following day’s premarket setups
This gallery contains 26 photos.
The end of day charts are the preliminary harmonic analysis for globex and following day’s premarket setups
Looking at the SPY bigger picture (day chart) and intraday perspective (hour chart) there’s some interesting observations. The day chart shows price has breached a wedge resistance and AB=CD level at 175.08 with some momentum divergence. A hold above this … Continue reading
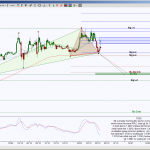
This gallery contains 28 photos.
The end of day charts are the preliminary harmonic analysis for globex and following day’s premarket setups
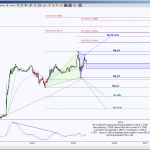
This gallery contains 24 photos.
The end of day charts are the preliminary harmonic analysis for globex and following day’s premarket setups
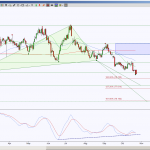
This gallery contains 32 photos.
The end of day charts are the preliminary harmonic analysis for globex and following day’s premarket setups
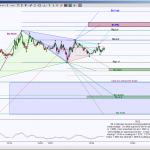
This gallery contains 26 photos.
The end of day charts are the preliminary harmonic analysis for globex and following day’s premarket setups
This gallery contains 26 photos.
The end of day charts are the preliminary harmonic analysis for globex and following day’s premarket setups