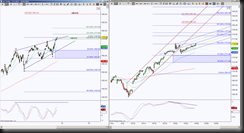
Looking at the SPY bigger picture (day chart) and intraday perspective (hour chart) there’s some interesting observations.
The day chart shows price has breached a wedge resistance and AB=CD level at 175.08 with some momentum divergence. A hold above this wedge implies attempt to test next ABCD target at 177.95. Typically wedges at the top of a move is a caution flag suggesting time for a pullback or stall. A hold below 175.08 implies an attempt to test the wedge support. Providing there’s not a higher high than 175.95, the ideal minimum retracement target for a harmonic pattern possibility is 168.23. Thus far the only harmonic patterns playing out are ABCD’s.
The intraday chart shows price broke down an uptrend channel (red) accompanied with bearish divergence, meaning the strength to the upside is waning. Currently price has made a new high with the breach of a previous high in attempts to retest the pitchfork midline. This correlates with the breach of the daily wedge resistance … so a hold above the level 175.93 (previous swing high), has extension targets 177.69, 178.40 & 179.92 which correlates with an AB=CD target at 180.42.
For the intraday “failure to have upside continuation” scenario, a hold below 175.93 has the pitchfork support line tgt which correlates with the 20 moving average. This becomes important initial support test, a break down there seeks a harmonic pullback target of at least 173.46

