
GCZ13 rejected heavy confluence on a big timeframe and intraday chart at 1407. How much pullback or retracement is key. Let’s look at the bigger picture, the day chart on the left had a Gartley PRZ (Potential Reversal Zone aka … Continue reading
Tag Archives: GC_F
Premium Members Harmonic Trading Charts for CL_F and Update on GC_F
Gallery
CL_F reached the 100% target for an Inverse Head & Shoulders pattern at 108.33 This correlates with two other daily Harmonic Patterns with completion targets right there with the H&S 100% target. The initial test on 7/19/13 retraced to 102.71, … Continue reading
Does GC_F Have Intraday C Point In?
Gallery
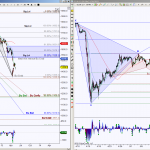
This gallery contains 2 photos.
Daily chart shows an attempt to retrace a small Bullish Crab, ideal minimum retracement target is 1526.2 Interesting that the intraday chart has an emerging Bearish Gartley pattern’s completion target 1532.6, this will help the daily pattern have an ideal … Continue reading
Premium Members Charts for 4/22/2013
Gallery
**Note ** Use these longer timeframe charts throughout the week, intraday charts will be posted daily. These charts are also setups for swing entries.
Premium Charts & Premarket Video for 4/16/2013
Gallery
Premium premarket video, click here.
Premium Charts & Premarket Video for 4/15/2013
Gallery
Premium premarket video, click here.
Premium Members Charts for 4/8/2013 – GC_F & DX_F
Gallery
GCM3 completed a daily Bullish Butterfly and an intraday Bullish Crab at the 1543.7 level The ideal minimum retracement target for the daily Butterfly is 1642.7 The intraday Bullish Crab has retraced it’s minimum target at 1572.1 A Bearish Bat … Continue reading
Premium Charts and Premarket Video for 3/15/2013
Gallery
Premium premarket video, click here.
Premium Charts and Premarket Video 2/6/13
Gallery
Premium premarket video, click here.
Premium Charts and Premarket Video 2/5/13
Gallery
Premium premarket video, click here.