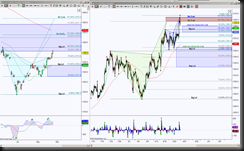
GCZ13 rejected heavy confluence on a big timeframe and intraday chart at 1407. How much pullback or retracement is key.
Let’s look at the bigger picture, the day chart on the left had a Gartley PRZ (Potential Reversal Zone aka completion target) at 1373.2 but price breached this level to test 1407 … this being an important level due to a daily GRZ (Golden Ratio Zone) and double bearish PRZ on intraday chart.
A hold above 1406.1 GRZ has target 1488.5 to complete the Bearish Garfly, this correlates with the midway point of the GRZ, a rejection there would have the bottom of the GRZ 1406.1 as an important support test. A push thru the 1488.5 has ideal target 1570.7 with scaling point 1541.7.
A hold below 1406 GRZ has initial sup test 1373.2, this was the daily Gartley PRZ, if this level fails to hold as support implies retracement mode has kicked into gear and has 1333.4 target.
Let’s switch to the intraday view, the small blue bearish Crab has retraced its ideal minimum at 1390.3 … this is a shallow retracement thus far, a hold above 1390.3 implies a stall and that forms a consolidation that I will then look for a break and hold to see if upside continuation or retracement mode wins.
If the small blue Bearish Crab retraces 78.6%, this will help price test the daily 1373.2 initial support test. If the small intraday bearish Crab retraces 100%, this will help the larger (green) bearish Crab retrace to its ideal minimum at 1355.4, a breakdown there has important support target at end of GRZ 1323.4 … this test helps the daily target of 1333.4. AND if the green intraday Bearish Crab retraces 100%, this will help price test the bottom of small GRZ 1277.3 on day chart.

