
Tag Archives: DX_F
Premium Harmonic Trading Charts & Premarket Video for 10/3/2013
Gallery
Premium premarket video, click here.
Premarket and End of Day Harmonic Trading Charts 9/16/13
Gallery
This gallery contains 26 photos.
The end of day charts are the preliminary harmonic analysis for globex and following day’s premarket setups
All Access Harmonic Trading Charts for 9/16/2013
Gallery
Premium Members Harmonic Trading Charts for 9/15/2013
Gallery
**Note ** Use these longer timeframe charts throughout the week, intraday charts will be posted daily. These charts are also setups for swing entries.
Premarket and End of Day Harmonic Trading Charts 9/11/13
Gallery
This gallery contains 28 photos.
The end of day charts are the preliminary harmonic analysis for globex and following day’s premarket setups
Premium Harmonic Trading Charts & Premarket Video for 9/11/2013
Gallery
Premium premarket video, click here.
Premium Members Harmonic Trading Charts for 9/8/2013
Gallery
**Note ** Use these longer timeframe charts throughout the week, intraday charts will be posted daily. These charts are also setups for swing entries.
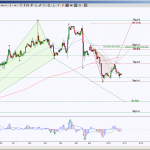
Premium Members Harmonic Trading Charts for DAX_F & SPY
Gallery
DAX_F, the Futures contract of the German index of stocks, has been busy forming multiple and opposing harmonic pattern rotations, of course this is typical when price is in a sideways range. Extreme regions of the range are 8565 and … Continue reading
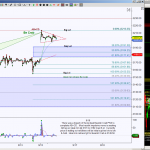
Premium Members Harmonic Trading Charts for DX_F and TF_F
Gallery
DX_F bigger picture (day chart) shows price is testing GRZ (Golden Ratio Zone) in the middle of wedge that began a year ago. The last attempt to test the wedge support in Jun 2013 fell short of the target, buyers … Continue reading