
Premium premarket video, click here.
Tag Archives: Charts
Premarket and End of Day Charts 3/3/14
Gallery
This gallery contains 26 photos.
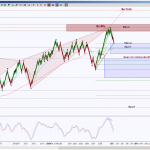
The left chart is current day’s premarket chart with analysis notes and premarket & lunch video links below, the end of day charts are the preliminary harmonic analysis for globex and following day’s premarket setups For premarket video, click … Continue reading
Natural Gas Futures In Retracement Mode
Gallery
NGJ14 completed a daily harmonic pattern called a Bearish Bat, and has been in retracement mode. So far this retracement is considered shallow, and price is stalling in the middle of a GRZ (Golden Ratio Zone aka the area between … Continue reading
End of Day Charts 2/28/14
Gallery
The end of day charts are the preliminary harmonic analysis for globex and following day’s premarket setups
Premium Members Harmonic Trading Charts for 3/1/2014
Gallery
**Note ** Use these longer timeframe charts throughout the week, intraday charts will be posted daily. These charts are also setups for swing entries.
Gold Futures Either Still Seeking Triangle Point or Time For Pullback Validation Test
Gallery
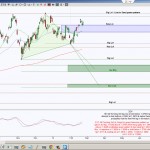
Gold Futures is currently testing a symmetrical retracement level for a Bullish AB=CD harmonic pattern, at 1340, how price behaves here offers clues to whether price is still seeking the third point of a triangle (which is the first two … Continue reading
Premium Members Harmonic Trading Charts for 2/24/14
Gallery
This gallery contains 6 photos.
**Note ** Use these longer timeframe charts throughout the week, intraday charts will not be posted daily this week due to my vacation. These charts are also setups for swing entries. Please view the short video on intraday perspective for … Continue reading
Premium Harmonic Trading Charts & Premarket Video for 2/19/2013
Gallery
CL April chart: CL, same analysis as March but different levels http://screencast.com/t/lBG0THUeP Premium premarket video, click here.
Shallow Retracement for Yen Futures’ Bullish Butterfly?
Gallery
Japanese Yen futures completed a daily bullish harmonic pattern, a Butterfly, and has retraced to it’s ideal minimum target. This retracement is shallow if price cannot push higher than .009935 and a shallow retracement for a bullish pattern is a … Continue reading
Premium Harmonic Trading Charts & Premarket Video for 2/18/2013
Gallery
Premium premarket video, click here.