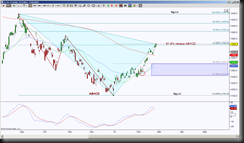
Gold Futures is currently testing a symmetrical retracement level for a Bullish AB=CD harmonic pattern, at 1340, how price behaves here offers clues to whether price is still seeking the third point of a triangle (which is the first two legs of most harmonic patterns) or whether the third triangle point is in place. If the latter is the case, then a pullback to at least 1281.8 does two things, one, it tests the bullish cross of moving averages, and two pulls back enough to form a necessary leg of a harmonic pattern.
 The Day chart shows the ABCD pattern retraced 61.8%. The ideal minimum pullback target is where the GRZ is. (GRZ = Golden Ratio Zone aka the area between the 38.2% to 61.8% fib ratios). It happens to be a confluence of a validation of a bullish cross. In this chart the moving averages are 20 sma and 50 ema, whenever a faster moving average crosses the slower moving average, it creates a cross and a bias, in this case, bullish. I like to utilize the tests of the crosses rather than the crosses themselves, but that’s just me.
The question that one needs to ask is, “What if price just stalls here rather than pulling back to validate that cross or touch that GRZ?” If this is the case, the probability skyrockets that the bias remains to the upside because the triangle is still seeking its third point and the retracement of that bullish AB=CD continues.
The red dot at the top of the last day’s candle is created from an indicator that was designed for me, called STPesavento, this is an aggressive signal for a rejection, a conservative signal requires follow through by showing some red bars and price to be below that green 20 sma (which happens to be the same as a Bollinger Band midline).
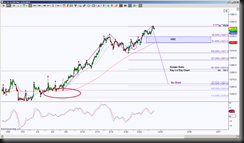
 Since it can take awhile for the conservative signal to play out, I like to go to a smaller timeframe, in this case an hour chart. This chart also shows a bullish cross (note the large red circle is the bullish cross on the day chart, the smaller red circle represents the hour’s bullish cross), so price doesn’t have to go as far to validate the hour’s cross or to test its GRZ.
The hour chart also has an aggressive signal for rejection of that 1343.6 level, so the initial support test is 1337.7, then 1334. A hold below 1334 invalidates the bullish cross and offers a more conservative short opportunity. A hold above 1334 or 1337.7 validates the bullish cross and offers a trending method setup for a long opportunity.
So, failure to push down and test these initial support test targets keeps the bias to the upside and supports the daily scenario that price is still seeking the third point of a triangle.
A breakdown of these initial support test targets increases the probability of testing that daily level of 1281.8 which happens to correlate with an hourly Golden Ratio level at 1284.5. If price is in this vicinity, there is a potential breach to complete a Bullish Shark harmonic pattern at 1264 region.
Final thoughts, allow price to tell the story on the hour chart to offer the larger moves suggested on the daily chart. The initial levels to break and hold are either above 1343.6 or below 1337.7, 1334 and 1329.7.
