
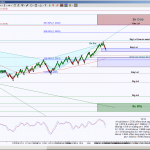
US Dollar day chart shows price in small downtrend channel while forming a Harmonic Pattern’s leg. This leg requirement can test 79.185, but a breach below it will invalidate the green pattern scenario and a hold below 79.185 has confluence … Continue reading
Tag Archives: Analysis
Premium Members Harmonic Trading Charts for 12/16/2013
Gallery
**Note ** Use these longer timeframe charts throughout the week, intraday charts will be posted daily. These charts are also setups for swing entries.
Premarket and End of Day Harmonic Trading Charts 12/13/13
Gallery
This gallery contains 26 photos.
The left chart is current day’s premarket chart with analysis notes, the end of day charts are the preliminary harmonic analysis for globex and following day’s premarket setups
Premium Harmonic Trading Charts & Premarket Video for 12/13/2013
Gallery
Premium premarket video, click here.
Premarket and End of Day Harmonic Trading Charts 12/12/13
Gallery
This gallery contains 26 photos.
The left chart is current day’s premarket chart with analysis notes, the end of day charts are the preliminary harmonic analysis for globex and following day’s premarket setups
All Access Harmonic Trading Charts for 12/12/2013
Gallery
Premium Harmonic Trading Charts & Premarket Video for 12/12/2013
Gallery
Premium premarket video, click here.
Premium Members Harmonic Trading Chart for ES_F
Gallery
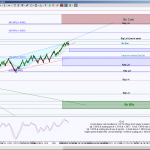
An hour chart offers a nice intraday perspective because it offers levels on a large enough spectrum but not too large to prevent price from reaching them. ES toyed with a Line in the Sand level 1812.50 but currently remains … Continue reading
Premium Members Harmonic Trading Chart for AAPL
Gallery
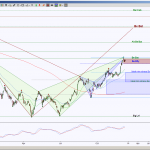
Apple has reached a region where two Harmonic Patterns have a similar completion target, this is called a double PRZ (PRZ aka Potential Reversal Zone), and becomes doubly important whether this zone can hold price or not. A hold below … Continue reading
Premarket and End of Day Harmonic Trading Charts 12/11/13
Gallery
This gallery contains 32 photos.
The left chart is current day’s premarket chart with analysis notes, the end of day charts are the preliminary harmonic analysis for globex and following day’s premarket setups