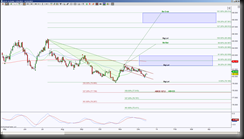
 US Dollar day chart shows price in small downtrend channel while forming a Harmonic Pattern’s leg.
This leg requirement can test 79.185, but a breach below it will invalidate the green pattern scenario and a hold below 79.185 has confluence target at 77.815 to 77.739 PRZ (Potential Reversal Zone).
A test of 80.669 region and hold offers a short opportunity to the double bottom at 79.185 and extended target of 77.815. A conservative long opportunity is a bounce off the channel support line, a hold above 79.185 or a close and hold above 80.669 or channel resistance line, with ideal target at 89.014 and scaling points at the green fibs shown on the chart and emphasis at 81.506, 82.223, 84.567 & 85.260.
