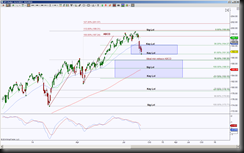
SPY, the ETF for S&P Emini Futures is currently showing signs of weakness due to an intraday perspective of a Bullish Harmonic Pattern having a shallow retracement. The bigger scenario using harmonic rotations shows price is in retracement mode of an ABCD Harmonic Pattern.
 First let’s look at the day chart which shows price breached the ideal ABCD target of 197.24 in an attempt to test an extension target or 199.31, but as soon as price failed to hold above 197.24, but rather broke down there, the retracement mode began. The ideal minimum retracement target is 189.30 region and a hold at that level or failure to get there is a sign of strength. So from the bigger perspective, price is pulling back into support until proven otherwise. One of those “proven otherwise” clues is for price to hold below 194.27, then to hold below 191.30, then the bias from up to down increases in probability with a hold below 189.20.
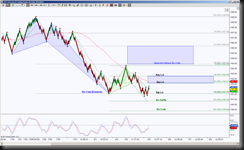
 For the intraday perspective, I’m using an STRenko 20 bar chart. This shows an extreme Bullish Crab harmonic pattern completed at 191.57 then attempted to bounce to the GRZ level 194.43, which is the ideal minimum retracement target. How much a harmonic pattern retraces tells a story, failure to get to at least 38.2% is a sign of stall or weakness. As of Tuesday, August 5, 2014, price failed to reach that 194.43 level, although came close, then proceeded to retest that 191.57 level. Now we’re at an interesting juncture because price has dipped below that 191.57 two times on this bar size chart but has no conviction as of yet to hold below it.
There are indications of weakness until price can hold above 192.61 first, then above 193.26 second. It is at this hold above 193.26 that the probability increases to test that 194.43 and if so, how price behave there offers how strong the bullish pattern is.
So these harmonic rotations are implying that the initial levels to break AND HOLD is either 192.61 or 191.57. A hold below 191.57 has the ideal intraday target of 189.88 and scaling point, aka potential bounce point, at 190.83. Note that the ideal target of 189.88 brings price closer to the daily target of 189.20.
A hold above 192.61 will have the initial target at the top of the GRZ at 193.26, above there increases the probability of that Bullish Crab going into retracement mode. Strong harmonic patterns ideal retracement is 100%, that would be 199.06 in SPY and each gray fib that price can hold above increases that probability. Note that if price can reach the ideal minimum retrace target of 194.43, this means price is testing the top of the daily GRZ 194.27 for a validation of an MA rollover.
