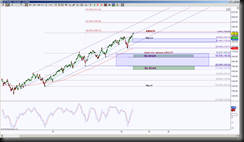
SPY has been in uptrend channel since end of 2012 and is currently testing a large ABCD PRZ (Potential Reversal Zone aka a harmonic pattern completion zone). There are two emerging Sharks that will help that ABCD pattern go into retracement mode.
 The day chart shows the current bias is to the upside, however one needs to be aware of important resistance levels, which SPY is approaching at 190.10. The Pitchfork midline can be used as a gauge as well. If there’s a rejection of 190.10 or hold below 188.96 then follow through by holding below the midline, the probability increases for the Sharks to play out.
The initial support test is 183.13, this is considered a scaling point or region to protect any profits since it is also a potential bounce point due to the confluence of support merging at this level.
But if price pushes off the midline and holds above 190.10, the Shark probability decreases and the ABCD extension targets as well as the Pitchfork resistance line is the focus.
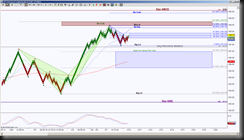
By looking at an intraday perspective, we can see what kind of clues are emerging while price is in between the day levels 190.10, the Pitchfork midline at approximately 187.33 and the 183.13 GRZ (Golden Ratio Zone aka area between 38.2% and 61.8% Fibonacci ratios).
 The 24 bar STRenko chart shows price is stalling in a triangular and sideways consolidation. Initial levels to watch for a break and hold is the small GRZ 188.38 or 188.01.
Above 188.38 has the ideal target of 189.91 to complete a bearish Crab, note this helps price reach the day target of 190.10, however initial resistance target is a completion of a bearish Bat at 188.79, this correlates with the retest of intraday bearish Crab PRZ (188.95 to 189.25).
Below 188.01 has the initial support test 187.43 which correlates with the Day pitchfork midline, so if price can retrace the ideal minimum of the intraday green bearish Crab harmonic pattern, at 186.97, this will help bring price below the daily midline. If the retracement mode gains momentum (aka downside bias), a 100% retracement target is 183.75, this will help price test the day GRZ level.
Study the intraday chart, it has the day levels noted in large font. The smaller harmonic patterns as shown on this intraday chart will help test those important levels.
