
$NQM16 has completed a bearish Butterfly harmonic pattern at 4421.75, now the key thing is whether price holds above or below the PRZ (Potential Reversal Zone aka the completion zone for a harmonic pattern). The upper portion of the PRZ is 4445 and the lower is 4374.25. Currently price is below the PRZ, and a hold below there implies a retrace mode with the ideal minimum target at 4199 and ideal target at 3853.25.
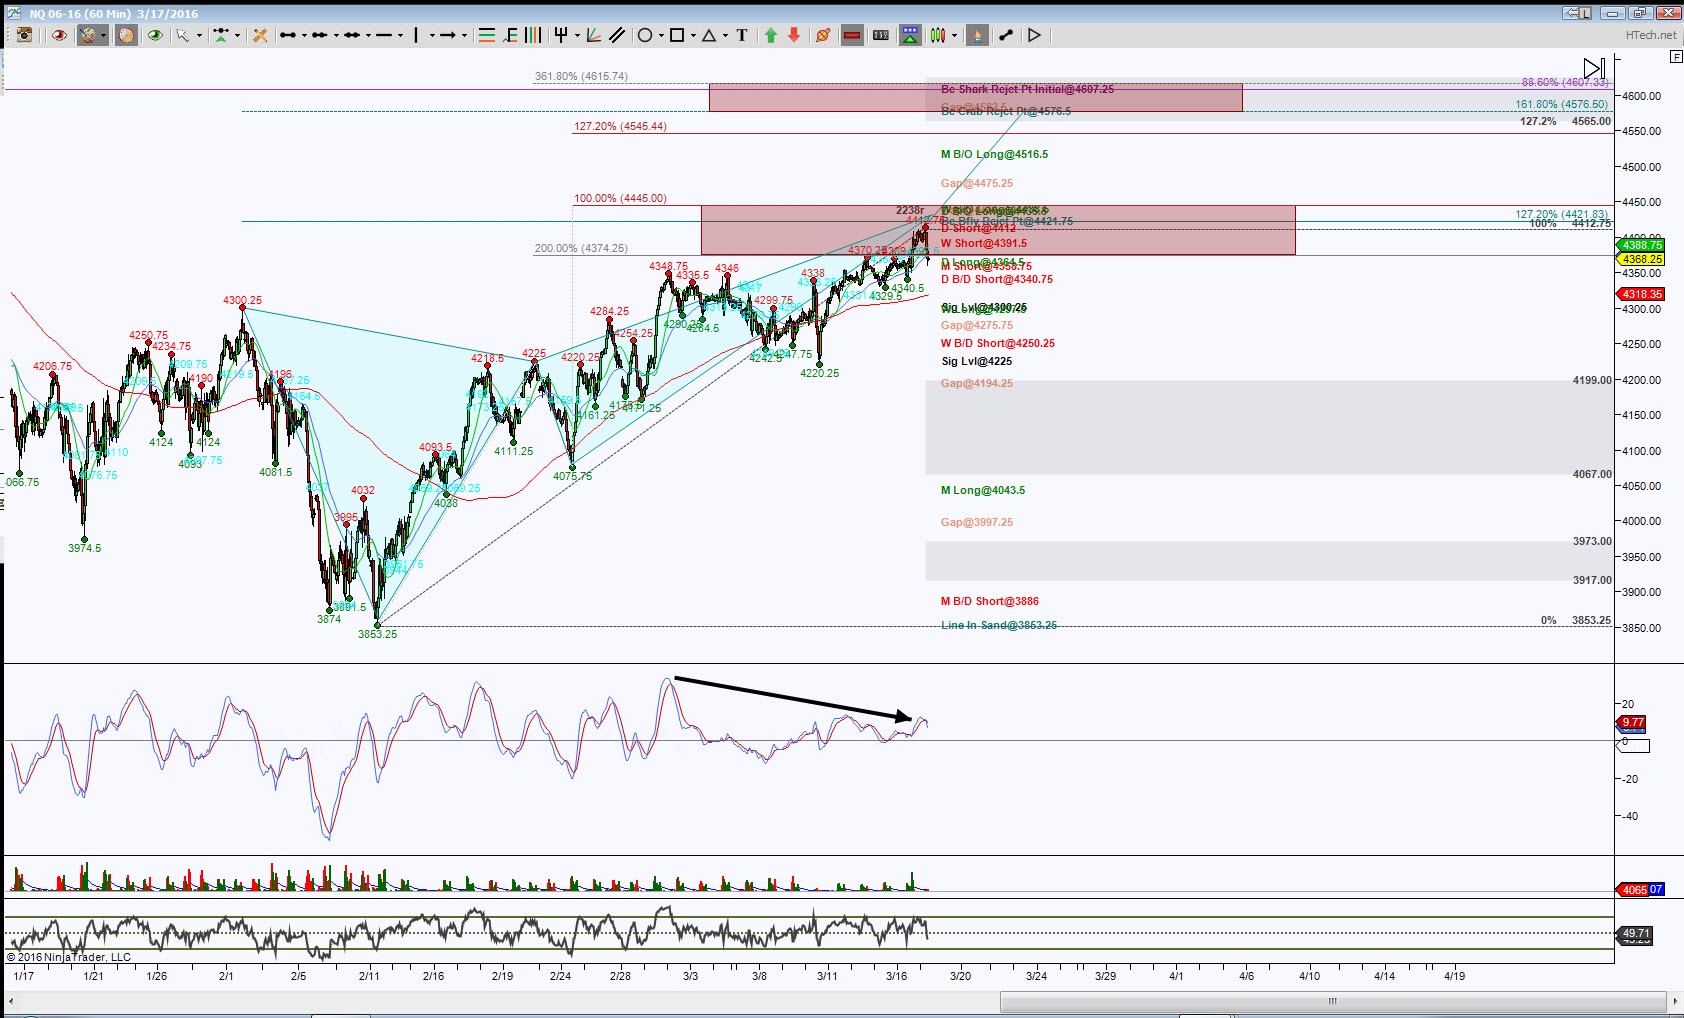
I’m using an intraday perspective using an hour chart. The cyan colored pattern represents the Butterfly and the red zones represent PRZ’s.
When a harmonic pattern begins its retrace mode there are initial things to look for, first whether can hold outside of the PRZ and second how much of a retracement occurs. In this case I have initial pullback targets between 4364.5 and 4340.75 then what I call Significant level targets at 4300.25 and 4225. Once price can hold below 4300.25 the probability strongly increases to test the retrace targets, each gray or noted level being key tests.
If price cannot reach its ideal minimum target of 4199, in other words holds above the initial pull back targets, the implication is a ttest of the extreme of the first PRZ at 4445, this becomes another very important test for resistance, a hold above it has a magnet target of a Double PRZ, this means there’s two totally different harmonic patterns that complete into one zone, this not only calls price to it, it becomes a very important rejection region.
Trading involves substantial risk and is not suitable for all investors. Past performance is not indicative of future results.