
To use football terminology, 3rd Down & 10 represents The December contract for E-mini S&P 500 Index, ESZ16 has limited time to stay where it is. Another down for continuation or a turnover to opposing team. Of course I’m referring to the Bulls and Bears as opposing teams, the Bears have the ball but can’t seem to move off the line of scrimmage at 2104.75. The market is holding its breath and at some juncture will need to exhale. So Bears need to convert to a 1st down or take out 2104.75 to increase the probability of a touchdown. Ideally on a larger scale, the ideal downside target for a touchdown is at a harmonic pattern PRZ (Potential Reversal Zone aka a completion target for a harmonic pattern) at 1816 but there are important support tests along the way (more 1st downs) at 2055.25, 2035.25 and 1975.
Otherwise, failure to take out 2104.75 could turn the ball over to Bulls and they will need to surge through 2185 for their 1st down and shift the bias from a downside pull to an upside pull. Continuation targets are currently 2242 and 2314.75.
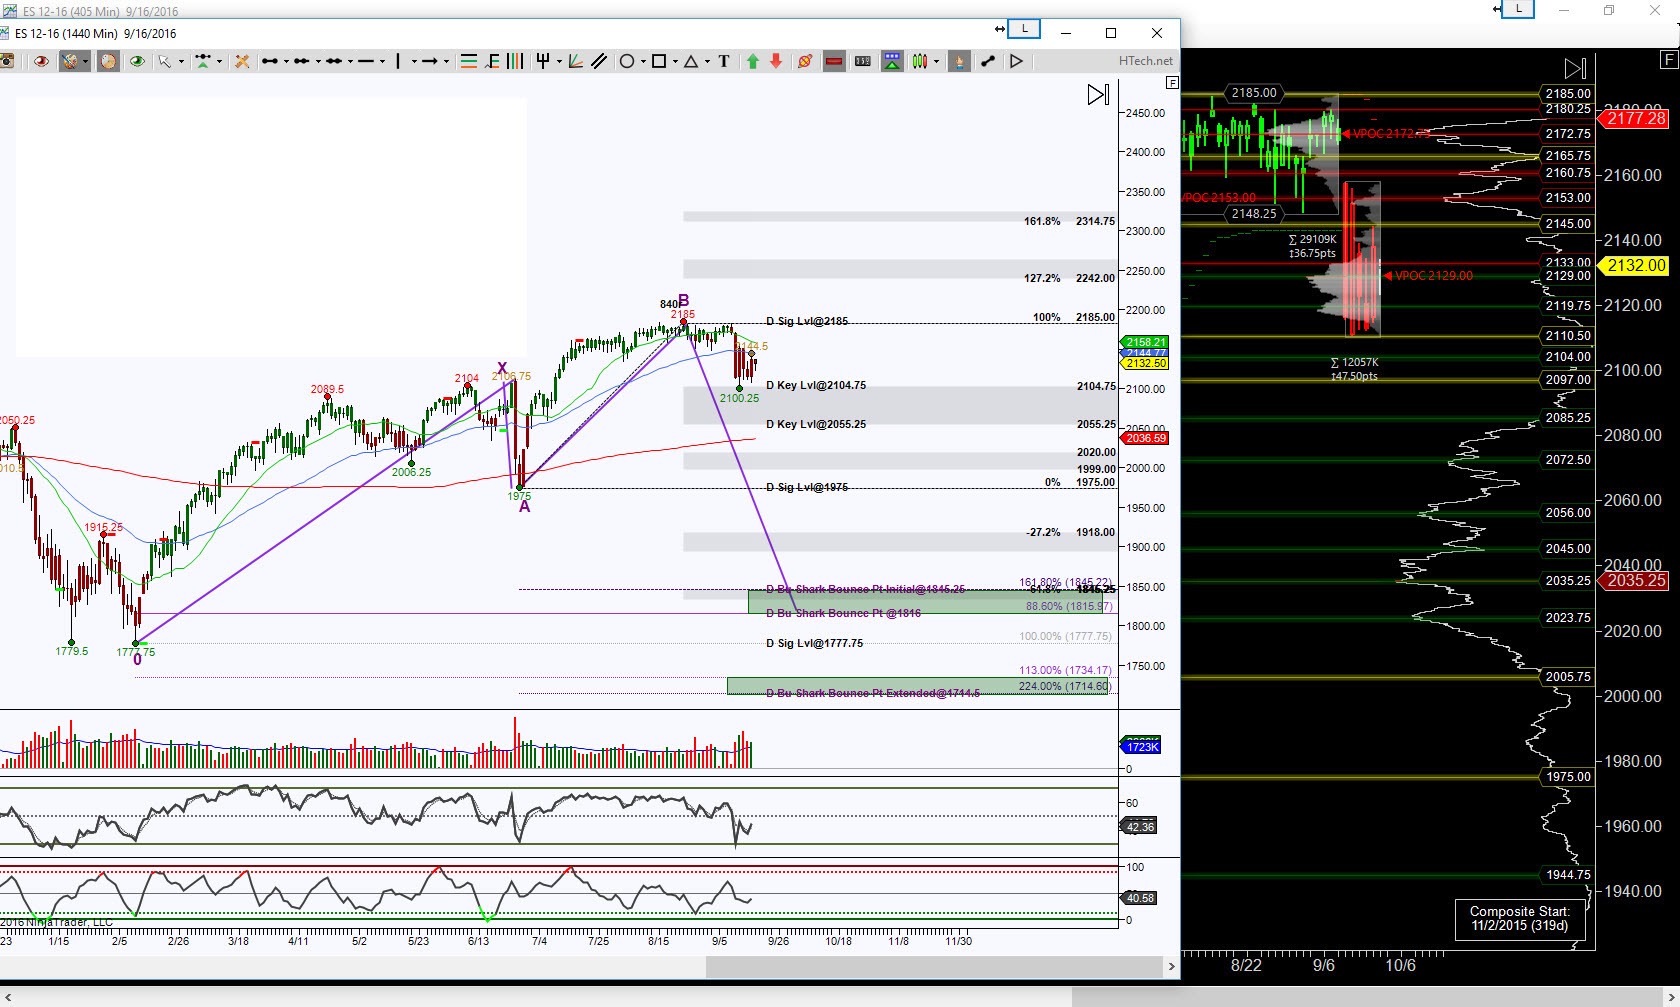
ES_F Day chart
For an intraday perspective, I’m using an STR20 bar chart, and it collaborates with the “holding its breath” scenario. This chart shows there are opposing emerging harmonic patterns, called a Butterfly and at this juncture its anybody’s game.
The right side shows an intraday Volume Profile chart, this represents RTH (Regular Trading Hours) only and distinctly shows that Friday, September 16th was an inside day of Thursday and a very narrow range which is indicative of “holding its breath”. The initial yellow zones, I call Neutral Zones, will be the initial levels to take out to increase the probability of reaching value, I like to call Magnets. These magnet targets are 2153 and 2172.75 to the upside and 2072.50 to the downside, for starters. These magnets, once reached will be helping the harmonics increase their chances in that particular direction.
Simply put, a hold above 2137 ideal scenario in the world of harmonics is to complete the brown colored Butterfly at 2205.25 and the ideal scenario below 2137 is to complete the green colored Butterfly at 2025. The noted levels on the chart represent points of interest or scaling points because they are first down targets and face a strong defense at those levels.
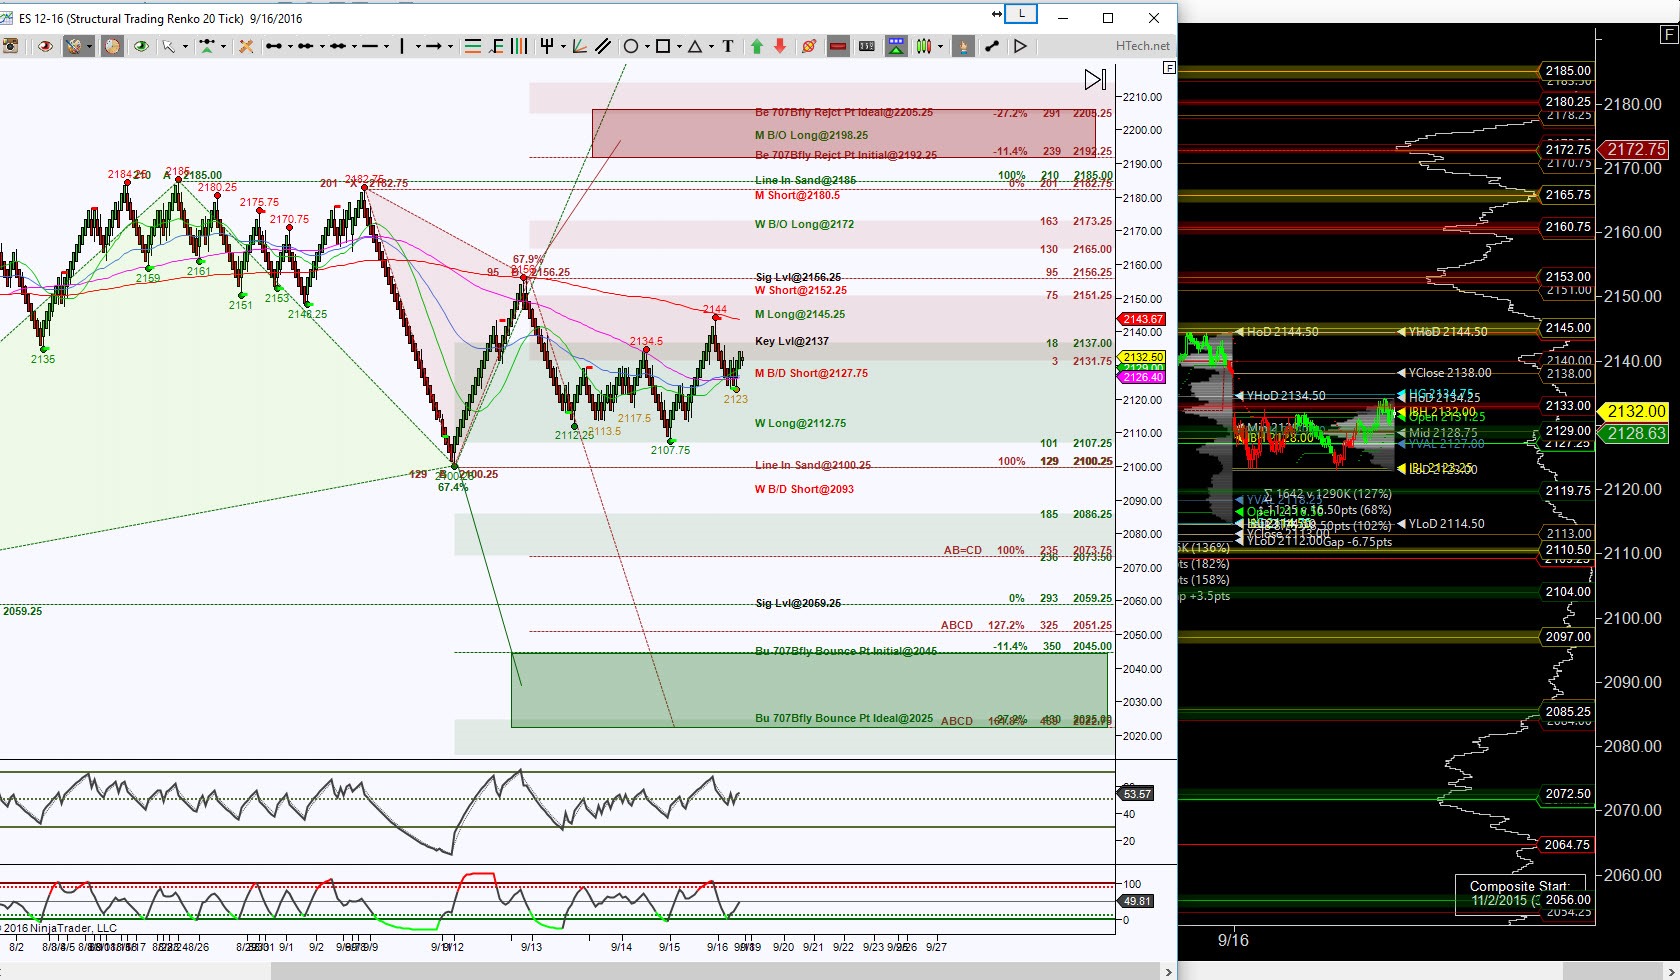
ES Intraday Chart