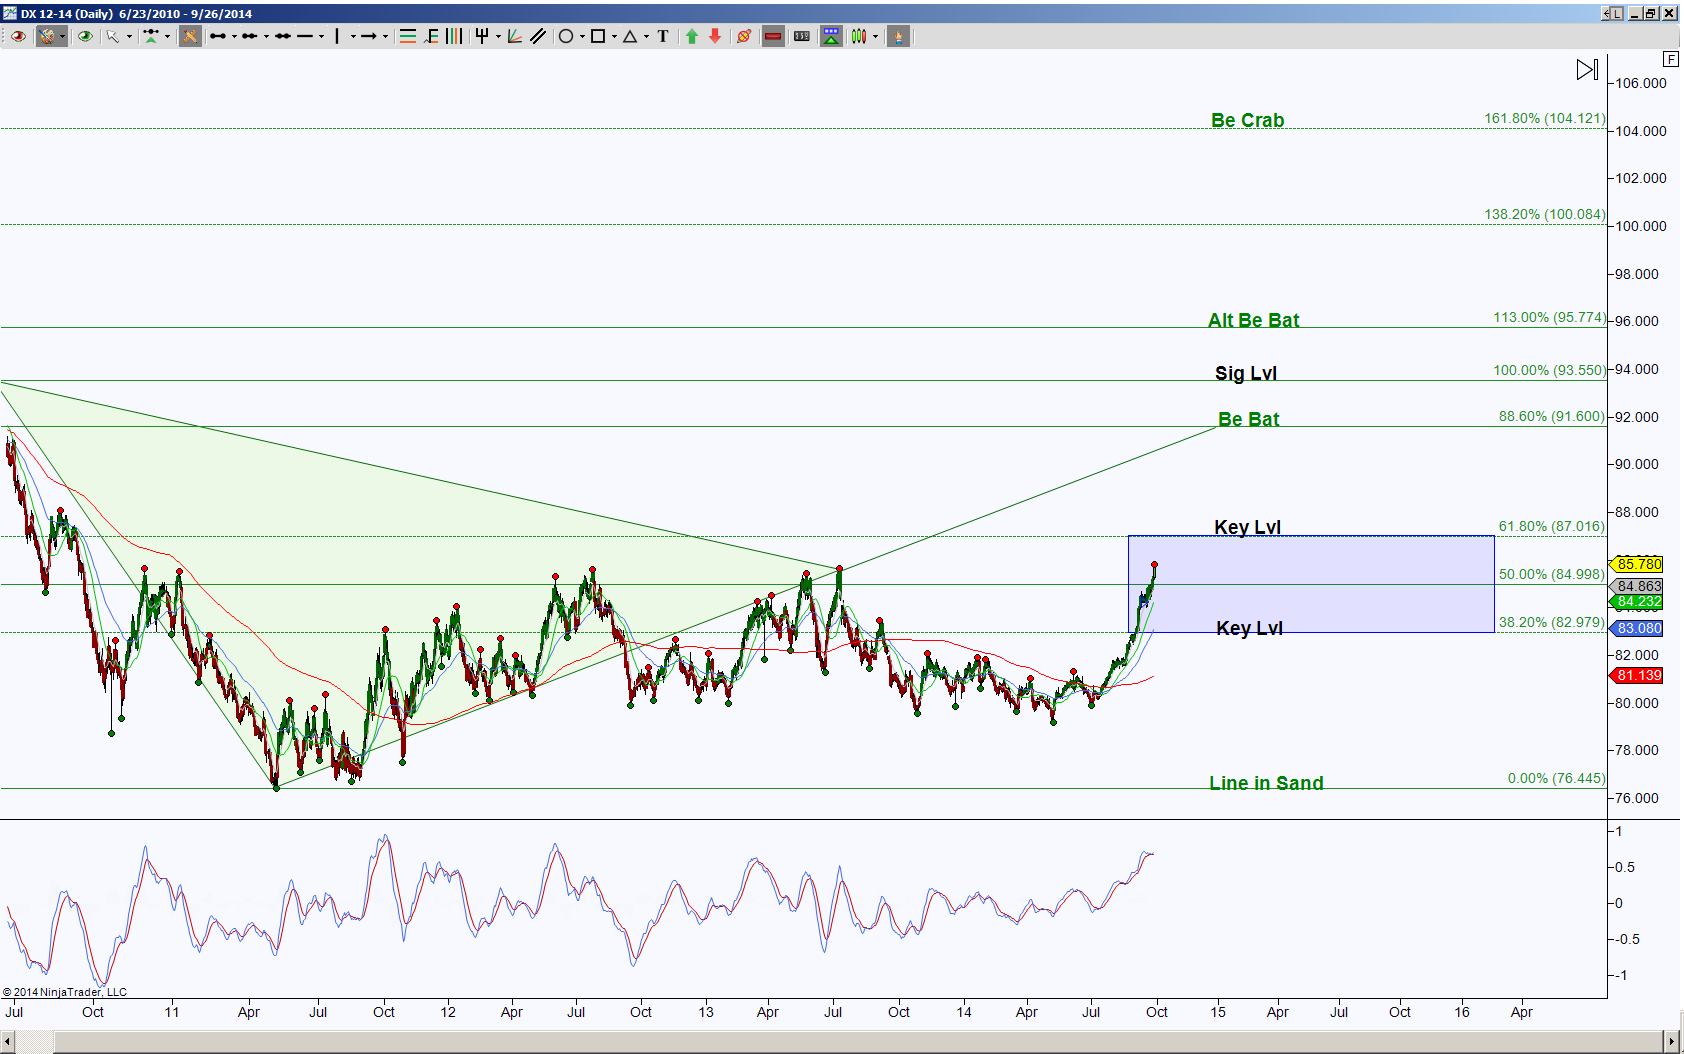
Click here to view the US Dollar analysis posted on September 22, 2014, this chart and comments are a follow up to that post. Then I was looking for a potential pull back from 84.912 or if price held above 84.935 the target was 85.650 and scaling points at 85.201 and 85.526.
The current chart above shows that there was not a pull back from 84.912, but rather price pushed above the ABCD scaling point targets and also took out the 85.650 high. So since those targets were met, I’ve updated the harmonic scenario with upside targets and pull back support test targets.
The day chart shows that price is currently inside a Golden Ratio Zone as shown with the blue rectangle, so the noted Key Levels of 87.016 or 82.979 are the initial important levels to break and hold. An upside break has harmonic pattern completion targets at 91.600, 95.774 and 104.121. Keep in mind that any of these PRZ’s (Potential Reversal Zone aka harmonic pattern completion zones) have a probability of being rejection points and how much they pull back are key.
For the downside scenario, first price will need to hold below 84.998 to increase the probability of testing the bottom of the GRZ, once price can hold below 82.979, the probability increases to retest the 76.445 target.
