
Please click here to view the Gold futures post on September 3, 2014. Then price was testing the bottom of a triangle support line and I had an initial resistance test at the triangle apex of 1303 and initial support test target of 1244.9 then line in the sand level target of 1213.8.
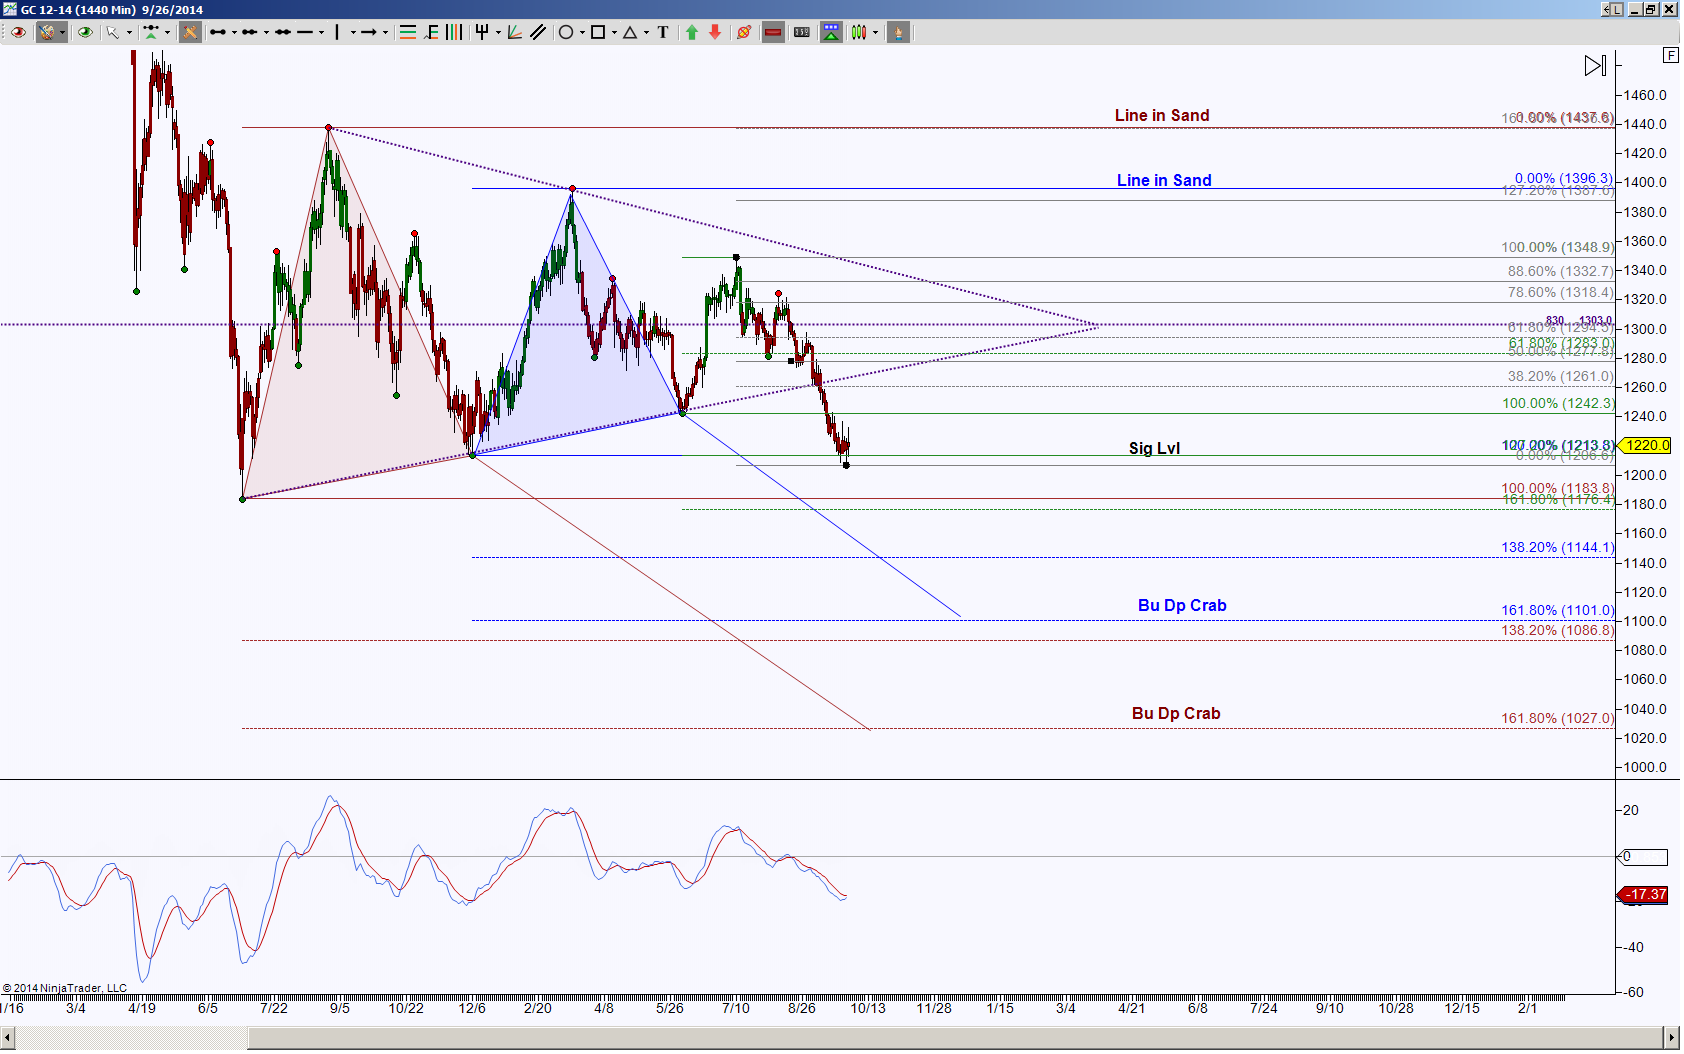
The current chart shows price did break down the triangle and is stalling at the 1213.8 target. The breach of this target invalidated the green colored emerging harmonic pattern so it has now been eliminated. This stall is creating a smaller consolidation formation and the initial levels to break and hold are either 1242.3 or 1206.6. An upside break has a high probability of validating the triangle breakdown point, this is a test of the triangle line as resistance. Above 1261 again has the 1303 target and implies the breakdown was a fake out, similar to a taunting “Made you look” comment. The triangle resistance trendline is the next important upside target and it is at this juncture I’ll watch for a valid breakout.
A couple of things to watch for to keep a downside bias created from the breakdown of the triangle, one is a test of the triangle from below and hold below it, this is a basic triangle breakdown trading strategy. The other is failure to even test the triangle breakdown point but rather a hold below 1206.6 level, if this is the case, then there are two Deep Crab PRZ targets to shoot for, these levels being tested increase in probability with each fib that fails to hold as support.