
ES Emini Futures has two near by Line in Sand levels which can offer directional probability and targets. A Line in Sand is like a “Do or Die” moment for a harmonic pattern while in its emerging stage. For an intraday perspective, I’m using an STRenko 16 bar chart.
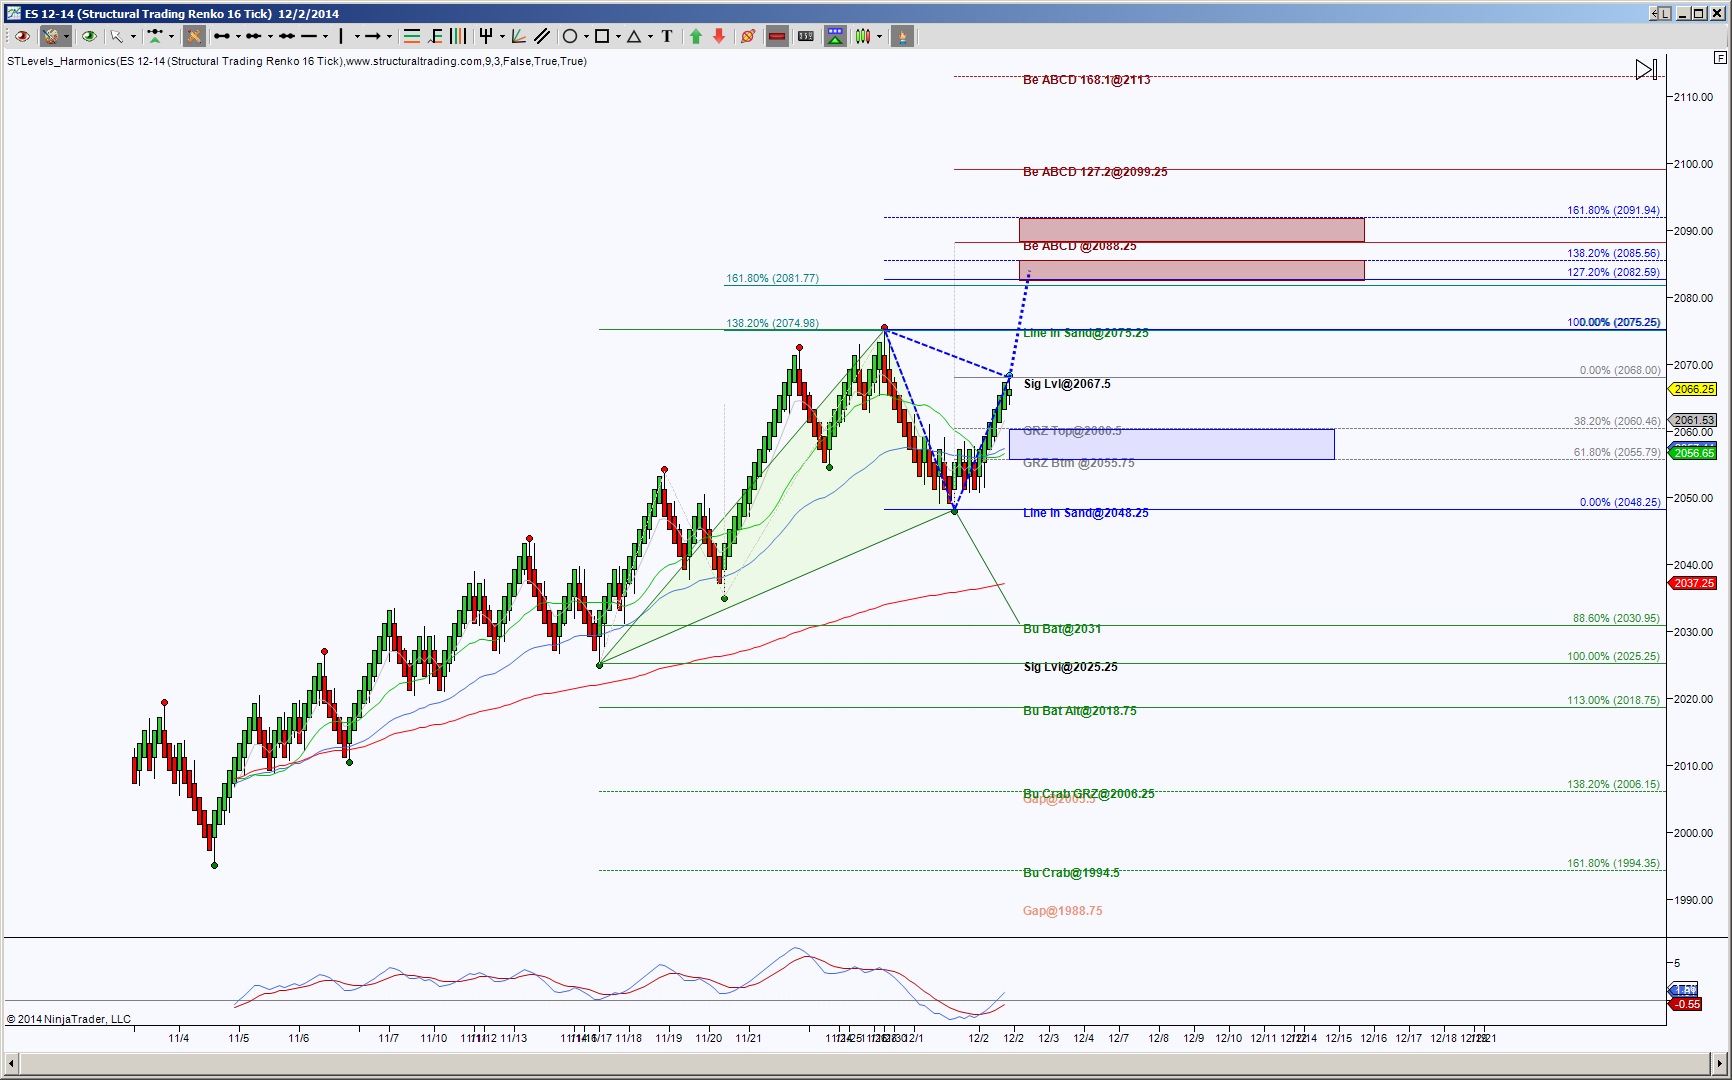
If you understand harmonic pattern language, then it’ll make sense to you when I say, price is forming a third of four legs of an emerging Bullish Bat with 2075.25 as its maximum target for its C point, and there’s an opposing pattern seeking its triangle point but requires a pull back to at least 2060.5 to form its 3rd of four legs.
If you don’t understand or are not interested in harmonic pattern jargon, I like to color coordinate my patterns with their respective triangles, fibs and harmonic pattern titles. So if you look at my chart with no knowledge of harmonic rotations, then you can see pretty colors that represent important levels for support and resistance.
If you just want the facts ma’am, then here’s the gist of what harmonic patterns and price action are saying to me:
Price currently has upside bias with a potential pullback to 2060.5 to 2055.75, below there shifts the bias to the downside. Simply put, because the current bias is bullish, a shallow pullback to 2060.5 or 2055.75 offers a long opportunity. The ideal upside target are the red zones which show confluence. Each noted level on the chart means if price can hold above one, the probability increases to reach the next one.
Below 2055.75 increases the probability of testing 2048.25 or the PRZ’s (Potential Reversal Zones aka a harmonic pattern completion zone) as noted on the chart, namely Bullish Bat at 2031, Alternate Bullish Bat at 2018.75 and Bullish Crab at 1994.5 with 2006.25 as an important level along the way. This means that if I’m in a short position, those downside targets are my scaling point targets or a place to protect my position.
Fibs are like bus stops, how many people get on and off a bus (or enter and exit a position) determines how long price stays at each fib. Harmonic patterns offers a predetermined idea which fib has a higher probability of being a rejection point, or u-turn, a rest stop or chop, and probability of not stopping for long, if at all at certain fibs.