
US Dollar is currently inside the Bearish Butterfly PRZ offering a support and resistance level to break and hold for directional bias.
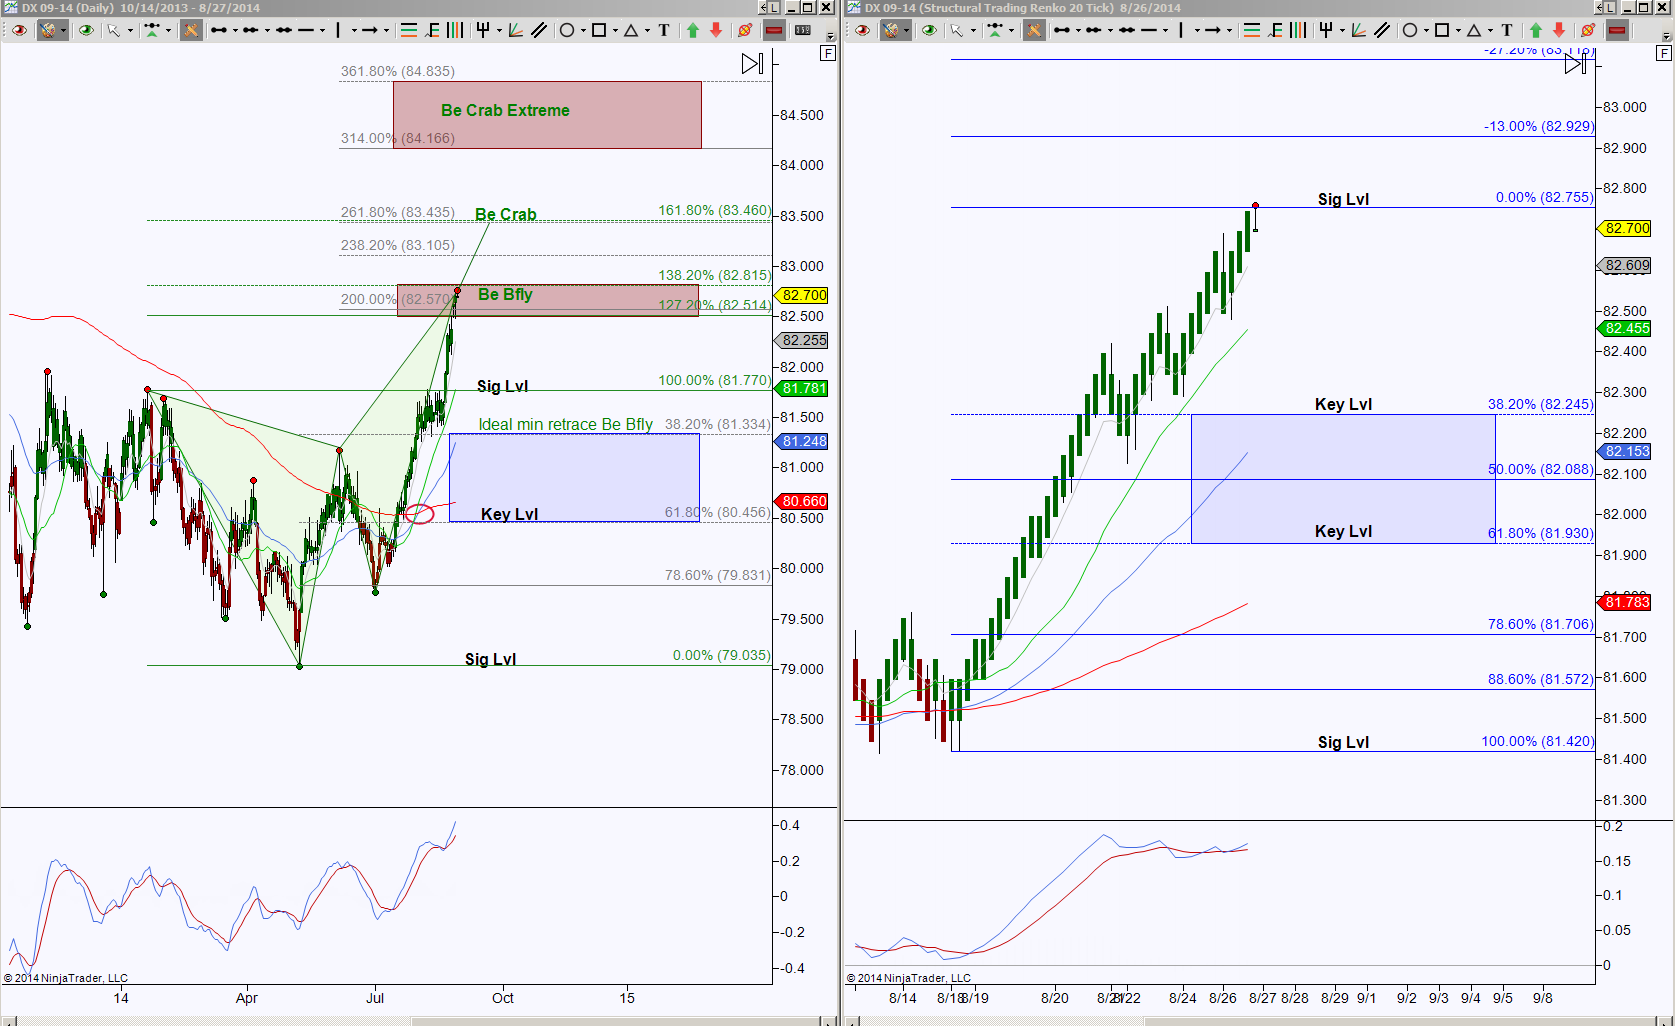
The left side of the chart is the Day bar size and the right side is the intraday perspective, in this case I’m using an STRenko 20 bar size. It’s the bigger picture that price is testing the PRZ and it shows that the initial levels to break and hold are either 82.815 or 82.514.
An upside break has the extended target 83.460 and scaling point at 83.105. A downside break has the ideal minimum retracement target at 81.334 and scaling points at blue fibs as shown on the right side chart as well as 81.770. There are indications for a third scenario to prepare for and that is there is potential chop inside the PRZ.
For clues, I’m looking at the smaller perspective, the right chart shows price is extended from it’s average region so a pull back into 82.455, 82.245 and 82.153 can give an interpretation regarding the strength of a pull back and whether it’s just to test support or the beginning of a retracement mode of that large Bearish Butterfly. Note that a pullback to these initial targets will take price below the Butterfly PRZ and the longer price holds below the zone, the higher the probability of retracement mode attempt.
Viewing the right side chart, that GRZ will be important support test targets and a break down of 81.930 increases the probability of testing the symmetrical retracement target 79.831 or the ideal target of 79.035
The overall bias is to the upside but there is some negative divergence and price is testing a bearish PRZ so a hold below the PRZ level 82.514 doesn’t necessarily mean a reversal but rather considered as a pull back into support until proven otherwise, and for me, that would be a hold below 81.334 first, and 80.456 second on the larger scale and below 82.245 on a smaller scale.