
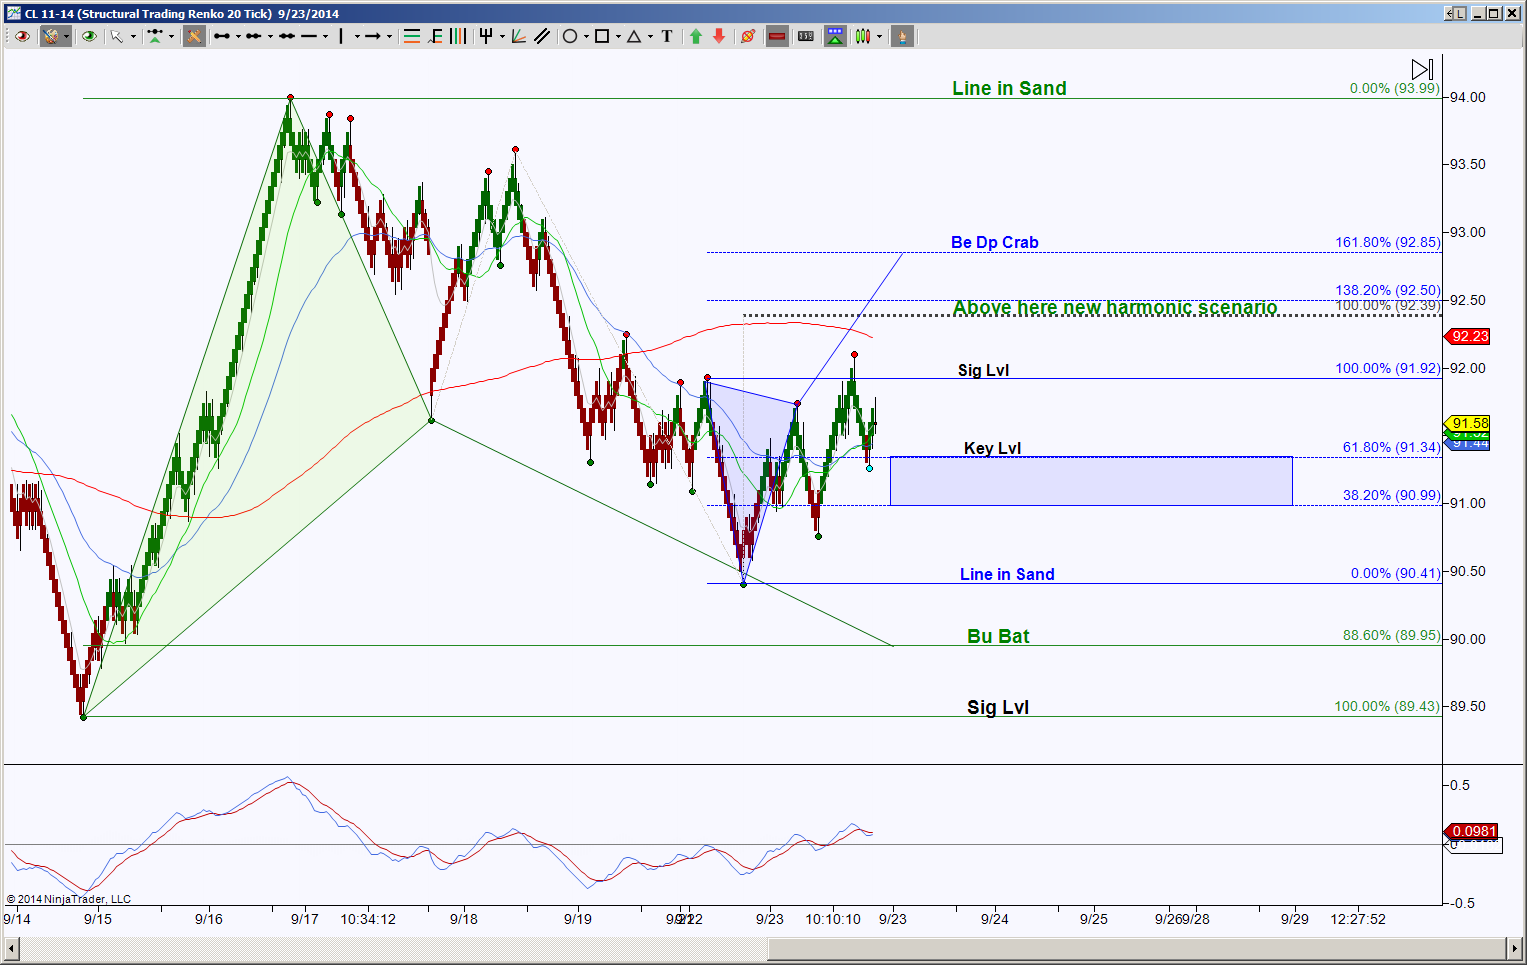
CL is in an emerging harmonic pattern, a Bullish Bat however there is criteria in he harmonic pattern world that is necessary to sustain the Bat scenario. This intraday perspective chart, I’m using an STRenko 20 Bar chart, shows that there are opposing emerging patterns and a very important level is the 92,39 test because this level has the power to change the whole dynamics of the larger green colored Bat into a Butterfly. If this sounds like the nature channel rather than harmonic pattern scenarios, don’t let that deter you from watching a very interesting scenario play out.
The initial levels to break and hold are either 91.92 or 91.34. Those that have followed me for awhile or attended some of my webinars, understand that I color coordinate my patterns and that my GRZ (Golden Ratio Zone) is always visible with a blue rectangle. I found that if I use repetitive ways of charting my chart then I can see at a glance what I’m observing.
If price holds above 91.92, that very important level of 92.39 becomes the primary initial target and above there will change the green colored triangle as well as the completion target. A hold above 92.39 does have another harmonic pattern target of 92.85, this also being a region of potential rejection but if it cannot hold down the bulls, then the 93.99 target is next.
If price holds below 91.34, the ideal target for an intraday perspective is 89.95 and scaling points at 90.99 and 90.41. Downside continuation has harmonic targets of 88.84 and 86.61 but that 89.43 will be an important support test target as well.
A ship sets sail with charting maps, a pilot has a charted plan of route, and an auto traveler has a road map. A sailor, pilot or driver may be going to places they’ve never been, just like we view the right side of a chart, but their maps offer them confidence of a means to an arrival. This is how I view harmonic patterns, I do not know where price will be a week from now, but harmonic patterns do offer a charted map, and if all things equal remains on course, there’s a high probability of that very pattern coming to fruition. We all know that human beings change their minds, we know that sometimes there’s detours and that roads are sometimes rebuilt taking a different direction, and so it is with charting the markets. If we can view harmonic patterns as a map but not a guarantee, it at least offers us a means of direction, of a destination, and knowing when to make a u-turn.