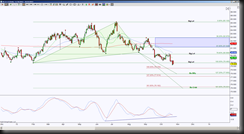
US Dollar at deciding point while stalls at a significant Harmonic Pattern level, 79.490. A hold above it implies an attempt to test 80.698, a hold above there would invalidate the bearish bias created by the falling moving averages and have the GRZ (Gold Ratio Zone) as the next important test levels. When moving averages are falling in a slope that faces around 4:00 on a clock, this is a bearish bias as long as price holds below these moving averages.
A hold below 79.490 has ideal target at the Bullish Crab PRZ (Potential Reversal Zone aka the completion target for a harmonic pattern) at 76.001 and scaling points at 78.755 and 77.955.
Note the green triangle, when the first two legs form for an emerging harmonic pattern, it forms three points and a triangle, each point of the triangle is important and are targets in relation to where price is. For instance, currently price is testing the originating point, so a hold above this point has the next point as the target, which in this case is 80.698 region, a hold above that point has the upper point as the ideal target at 85.135 with the GRZ levels as scaling points along the way.
So DXZ13 is at a line in the sand at 79.490 … above it has the triangle point targets, below it has the harmonic pattern completion targets at 77.955 and 76.001

