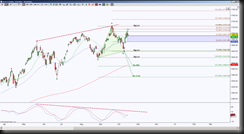
ES_F pushed through a small GRZ (Golden Ratio Zone aka area between fibonacci ratios 38.2% to 61.8%) and is currently stalling, a hold back below 1691.75 implies the C point is in for an emerging harmonic pattern, a Bullish Butterfly / Crab. There’s still some more room before this scenario is invalidated, the maximum target for the C point is 1723.75, so as long as price doesn’t breach this level, the emerging green Harmonic pattern remains in play.
Notice also, there is divergence in momentum compared to price … it’s said that momentum precedes price. The divergence comes from price making higher highs while the momentum indicator makes lower highs. So if indeed the momentum is preceding price, it suggests an increased of probability of the green Harmonic pattern playing out … or at least an attempt to.
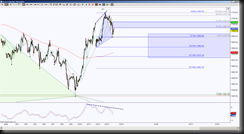
Now let’s go to a smaller intraday chart to get a better feel for how price is behaving at this stall region.
I’ve left the drawings from the day chart on the hour chart to see a condensed view of how price is behaving at the daily levels. Notice there is bearish divergence on the hour chart as well … however, keep in mind there’s no specific time line as to momentum preceding price, and price could be in an emerging Harmonic pattern as shown with the blue triangle, this particular pattern requires a bounce to at least 1697.25 and can go as high as 1709.75 to remain valid, so this states there’s a potential upside move prior to price following momentum. If price can get to at least 1697.25, this being the minimum requirement for a harmonic leg, then the completion target is either 1673.25 or 1663.25 … this completion of either target will help price test or break below the daily GRZ, thus implying the C point is in and downside becomes the bias to complete the harmonic pattern.


