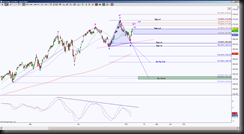
SPY is forming a BC leg for a Harmonic Pattern, Bullish Deep Crab, or a potential right shoulder for Head and Shoulders Pattern … or one could look at it that the BC leg is helping form the right shoulder. Harmonic patterns are like that, they contribute to other patterns!
Looking at the daily chart, price is currently attempting to hold above a GRZ (Golden Ratio Zone, this is comprised of the area between 38.2% to 61.8% fib ratios), as long as price holds above 170.14, the implication is the Harmonic Pattern’s BC leg and or right shoulder is still forming. 173.6 is the max target for the C point, and that would invalidate the Head and Shoulders, since the shoulders are designed to be below the head.
Providing this scenario plays out, once price holds below 170.14, this is the initial signal that the C point and right shoulder are in place, the probability of this interpretation increases with a hold below the bottom of the GRZ, 167.99.
A hold below 167.99 has initial support test at the pink neckline, then the retest of the B point at 164.53. The 100% target for the Head and Shoulders target would be a breach of the Bullish Deep Crab PRZ (Potential Reversal Zone aka harmonic pattern completion target), so it’ll be important if price does reach 155.47, to note what occurs after that … a bounce back above 156.79 suggests attempt to retrace the Harmonic Pattern. A break down of 155.47 has confluence at the Head and Shoulders 161.8% target and another Harmonic Pattern, a Bullish Shark at the PRZ 151.1 to 149.45.
And … just in case price takes out 173.60 and invalidates the Shark, the Deep Crab and the Head and Shoulders, the initial target is 176.07.

