DXZ13 bigger picture scenario was posted in Opening Print Oct 23, 2013
This is the follow up to that analysis by zooming into a smaller timeframe
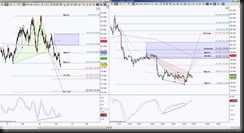
On the left side is the daily perspective, on the right side is an intraday perspective. Both timeframes have emerging Harmonic Patterns occurring and although the larger timeframe has downside bias to complete either the green bullish Butterfly or the Crab, the intraday chart (hour timeframe) shows that as long as price holds above the 79.060 level, there’s an emerging harmonic pattern, bearish Bat … a completion of this bat will help price test the day significant level 79.490 from below. Last week this was an important support test, now it’s an important resistance level and the Bat will help test that resistance.
The daily chart shows falling moving averages that are upside targets if price holds back above 79.490, because they are validation of a bearish cross. (Bearish cross is when a faster moving average crosses below a slower moving average) The completion of the hourly Alternate Bearish Bat harmonic pattern will help test the faster 20 daily moving average.
The completion of the hourly Bearish Crab harmonic pattern at 80.379 helps push price above the daily 20 and seek the significant level 80.698 which correlates with the daily 50 (aka the slower moving average). A hold above there has exact confluence of both the daily and hourly level 81.646, so this becomes a magnet.
So with a hold above 79.060, harmonic patterns have offered awesome upside targets. It’s definitely a good idea to be prepared for the scenario of the 79.060 failing to hold as support, so a close and hold (this means either a bounce into this level and rejects it as a solid resistance or continues to move away from it to the downside) has the daily targets of 78.755 (this is a harmonic pattern AB=CD target), 77.955 and confluence target 76.100 region. There is momentum divergence on both the daily and hourly perspective, so this suggests more upside bias than downside coming. Understanding price action will help determine that upside scenario … one clue … how price behaves at 79.060, IF it can get there.

