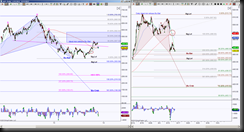
AAPL completed a daily Bullish Bat Harmonic Pattern in April 2013, retested that Bullish Bat PRZ (Potential Reversal Zone aka Harmonic Pattern completion target) in June, then began the retracement mode. Strong Harmonic Patterns enjoy over 61.8% retracement, awesome Harmonic Pattern retracements are 100% or more.
The AAPL chart shows the daily perspective on the left and intraday perspective on the right (hour chart). The initial test of the Bullish Bat PRZ back in April was an embarrassment in retracement terms, however the second test of the PRZ had a respectable retracement, known as the ideal minimum target.
There was a bullish cross on the Day chart as shown with the red circle, this is when a faster moving average (mine is a green 20 sma) crosses above a slower moving average (50 ema). Once this occurs, pull backs to test those moving averages offer what I call a “Validation Test” of that cross. If price cannot hold above the slower moving average (50 ema), I consider that failure to validate the cross. Currently price is below the daily 50 in attempt to invalidate that bullish cross.
Now let’s shift to the intraday chart. Note the top of a brown Bullish Bat … it’s pretty amazing to me that many times a pattern will repeat itself in an instrument …anyway … the top of the brown Bullish Bat is the daily ideal minimum retracement target. The completion attempt of the hour Bullish Bat is what caused the push below that daily 50 moving average. The ideal target (PRZ) is 460.50 however there is Fibonacci confluence at 465 where price is stalling.
Putting it all together, price is at a stall point, there is a potential breach of 464 to test the ideal completion target of Intraday Bullish Bat at 460.50 … how much this retraces tells a story … can it retrace 100% for a retest of that Daily level 507.32? Or will the falling 50 on the hour chart (remember, this is for a validation of a cross, but this time a bearish cross) prevent price from having that strong of a retracement?
There’s no guarantee which scenario will play out so conservative approach is a short opportunity with a bounce into the hourly falling 50, currently this correlates with the daily Head & Shoulders pattern, so there’s probability of rejection and the risk needed to see if that’s a good decision is above both the neckline and the falling 50. A daily target is 353.59, there are scaling points derived from the hour chart at 451, 436.50, 430, 416.5, 403.11 and 388.87.
A conservative long opportunity is a hold above that neckline and hourly 50 with key target at 507.32 and scaling points at 486, 507.92 and 513.74.

