
Premarket & End of Day Charts 4/25/2013
Gallery
This gallery contains 24 photos.
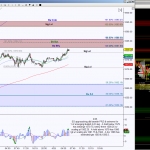
Here are the premarket charts and end of day charts to see what was the plan and how it unfolded Next week this post will be for premium members only Premarket / EOD
All Access Charts for 4/25/2013
Gallery
Premarket & End of Day Charts 4/24/2013
Gallery
Here are the premarket charts and end of day charts to see what was the plan and how it unfolded Premarket / EOD CL ES NQ 6E TF DAX
All Access Charts for 4/24/2013
Gallery
Premarket & End of Day Charts 4/23/2013
Gallery
Here are the premarket charts and end of day charts to see what was the plan and how it unfolded Premarket / EOD ES TF NQ CL 6E DAX
All Access Charts for 4/23/2013
Gallery
All Access Charts for 4/22/2013
Gallery
Premium Members Charts for 4/22/2013
Gallery
**Note ** Use these longer timeframe charts throughout the week, intraday charts will be posted daily. These charts are also setups for swing entries.
Premium Charts & Premarket Video for 4/22/2013
Gallery
Premium premarket video, click here.