
Premium premarket video, click here.
All Access Harmonic Trading Charts for 12/17/2013
Gallery
Premium Members Harmonic Trading Chart for SPY
Gallery
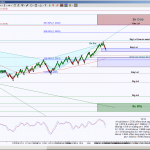
SPY completed extended ABCD target at the 127.2% and is currently attempting to go into retracement mode. The ideal minimum retracement target is 171.81, there’s a small emerging cyan Harmonic Pattern with PRZ (Potential Reversal Zone) targets at 175.56 and … Continue reading
Premium Members Harmonic Trading Chart for DX_F
Gallery
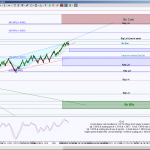
US Dollar day chart shows price in small downtrend channel while forming a Harmonic Pattern’s leg. This leg requirement can test 79.185, but a breach below it will invalidate the green pattern scenario and a hold below 79.185 has confluence … Continue reading
Premium Members Harmonic Trading Charts for 12/16/2013
Gallery
**Note ** Use these longer timeframe charts throughout the week, intraday charts will be posted daily. These charts are also setups for swing entries.
Starting Now! LIVE Real Traders Webinar Year-End Event
Gallery
This Saturday, You’re Invited To Join Us For A Special LIVE Event Where I’ll Be Presenting… Along With A Whole Line-Up Of Other Trading Experts… …Held By “Real Traders Webinar.” Click Here To Claim Your Seat Right Now For The … Continue reading
Premarket and End of Day Harmonic Trading Charts 12/13/13
Gallery
This gallery contains 26 photos.
The left chart is current day’s premarket chart with analysis notes, the end of day charts are the preliminary harmonic analysis for globex and following day’s premarket setups
MrTopStep Bootcamp starts tomorrow!
We are holding our final Boot Camp for 2013
Trade live with our traders:
- Kathy “Structural” Garber
- Frank “The Boss” Ochoa
- Jack “Bonds” Broz
Get live updates from the floors of the CME and NYSE and enjoy a complimentary ride on the MiM for a week as we team trade the close.
Boot Camp starts tomorrow December 13th at 8am CT / 9am ET
To join us go to -> Boot Camp Enlistment <-
Premium Harmonic Trading Charts & Premarket Video for 12/13/2013
Gallery
Premium premarket video, click here.
Premarket and End of Day Harmonic Trading Charts 12/12/13
Gallery
This gallery contains 26 photos.
The left chart is current day’s premarket chart with analysis notes, the end of day charts are the preliminary harmonic analysis for globex and following day’s premarket setups