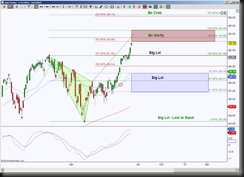
On June 8, 2014, I analyzed a chart for QQQ for a member’s request.
 THEN price was approaching a bearish PRZ between 93.09 to 94.45, indications showed price had a probability of stalling or pulling back into support targets 90.04 and 89.18. Failure to pullback to 91.36 would be a sign of strength, implying an attempt to test all levels inside the PRZ or reach for the extended target 96.35.
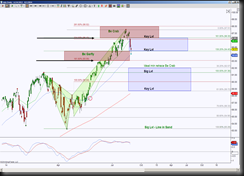
 NOW, approximately two months later, it shows where the lower black arrow points, that price stalled versus pulling back into support at the 93.07 test, and once price pushed inside the PRZ, it pushed to the top of the zone 94.45, breached it, then held as support. This hold above the PRZ increased the probability of testing the extended PRZ 96.15 to 97.99. All levels have not been touched in this PRZ, however, most of them before price gapped below the PRZ support, pointed out with the higher black arrow.
So these harmonic patterns and levels back in June, gave scenario’s of upside bias continuation when price failed to pull back into support from 93.07, then hold above it. They also gave us targets to scale or prepare to exit the position, namely the extended PRZ target 96.15.
Now price is at an interesting juncture, in that price has pulled back into support, namely the GRZ level 94.45 which correlates with the validation of the bullish cross that formed in May 2014. Friday’s candle showed indecision here, so this offers a new scenario of either a bounce into resistance with 96.15 again being an important resistance level or a hold below 94.45 having retracement targets as shown with gray fibs and the ideal minimum target at 92.07.
