
Those who have STLevels can refresh the GC chart.
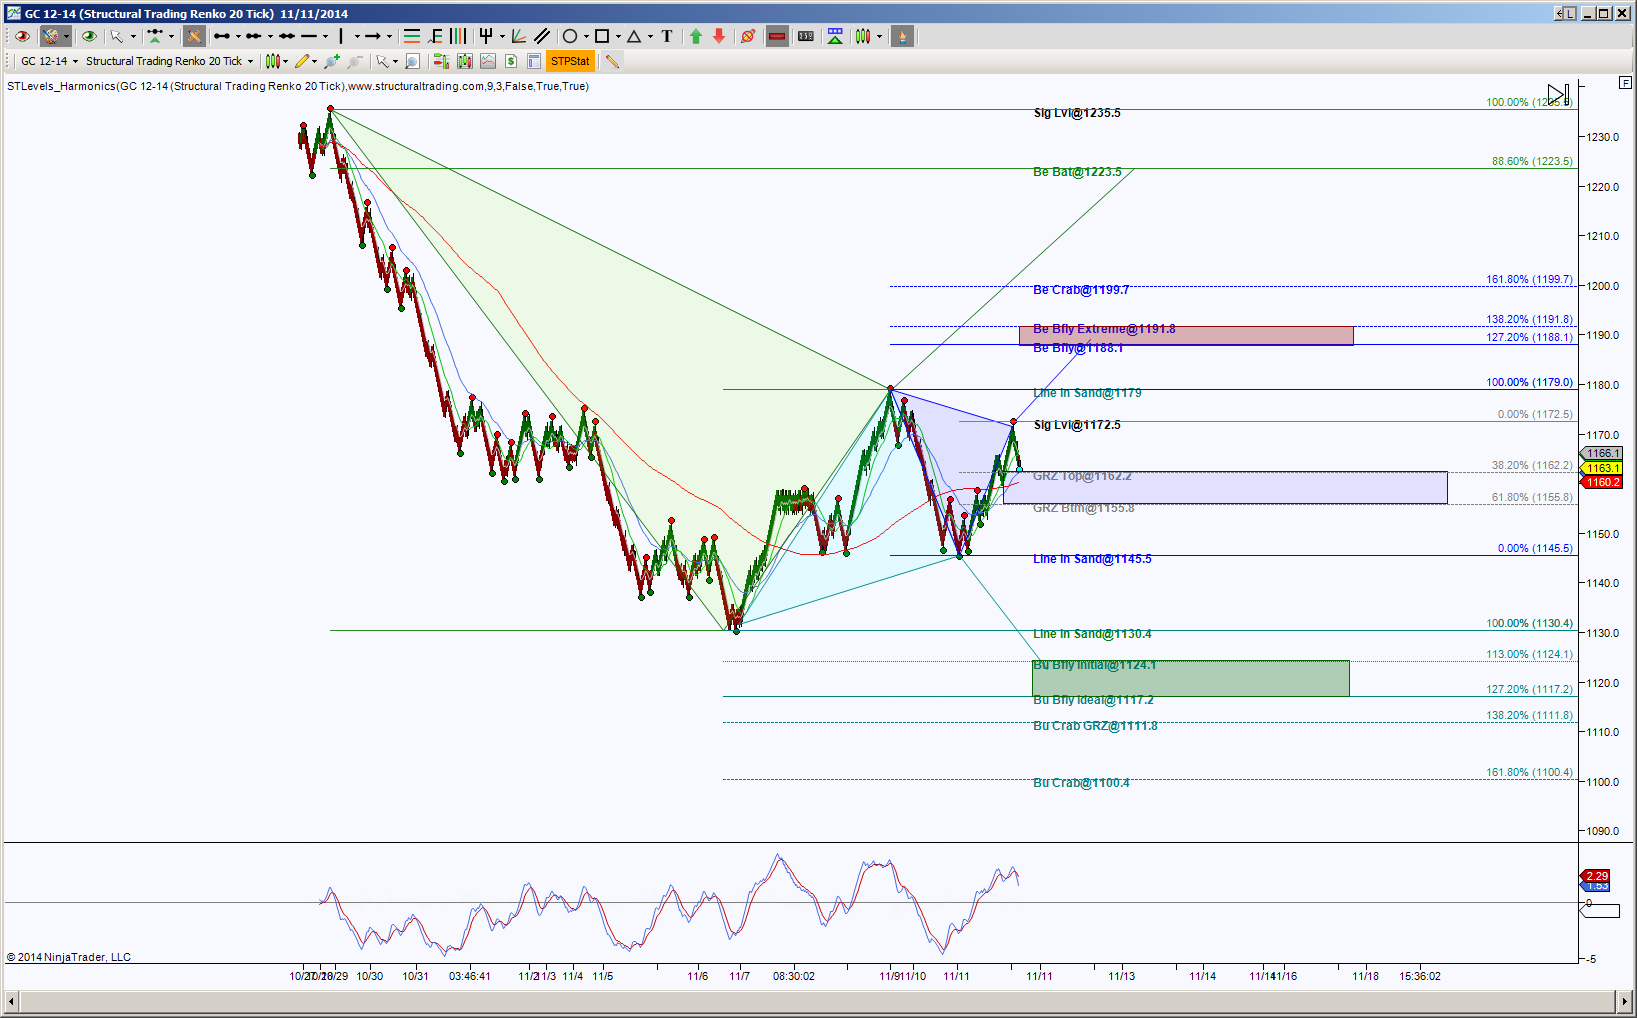
THEN, earlier this week, the harmonic scenario was posted that if price could break and hold above 1172.5, the completion targets for the blue pattern were 1188.1, 1191.8 and 1199.7. Click here to see that post.
NOW, the 1181.1 to 1191.8 PRZ target was hit, so what to expect from here? PRZ’s are Potential Reversal Zones aka completion targets for a harmonic rotation or pattern. Note that price tried to sneak above the PRZ but since then has been stalling inside the zone. Harmonic patterns dream of retracing 100% but there’s parameters along the way to gauge the strength, if any of a reversal pattern. The retracement mode likens a baby learning to walk. If price can get to the GRZ (Golden Ratio Zone) that’s like a baby crawling, the initial process of movement. Once price can exceed 61.8% retracement the child is walking, the intermediate stage of movement, and then the 100% or more retracement, that’s running, complete movement!
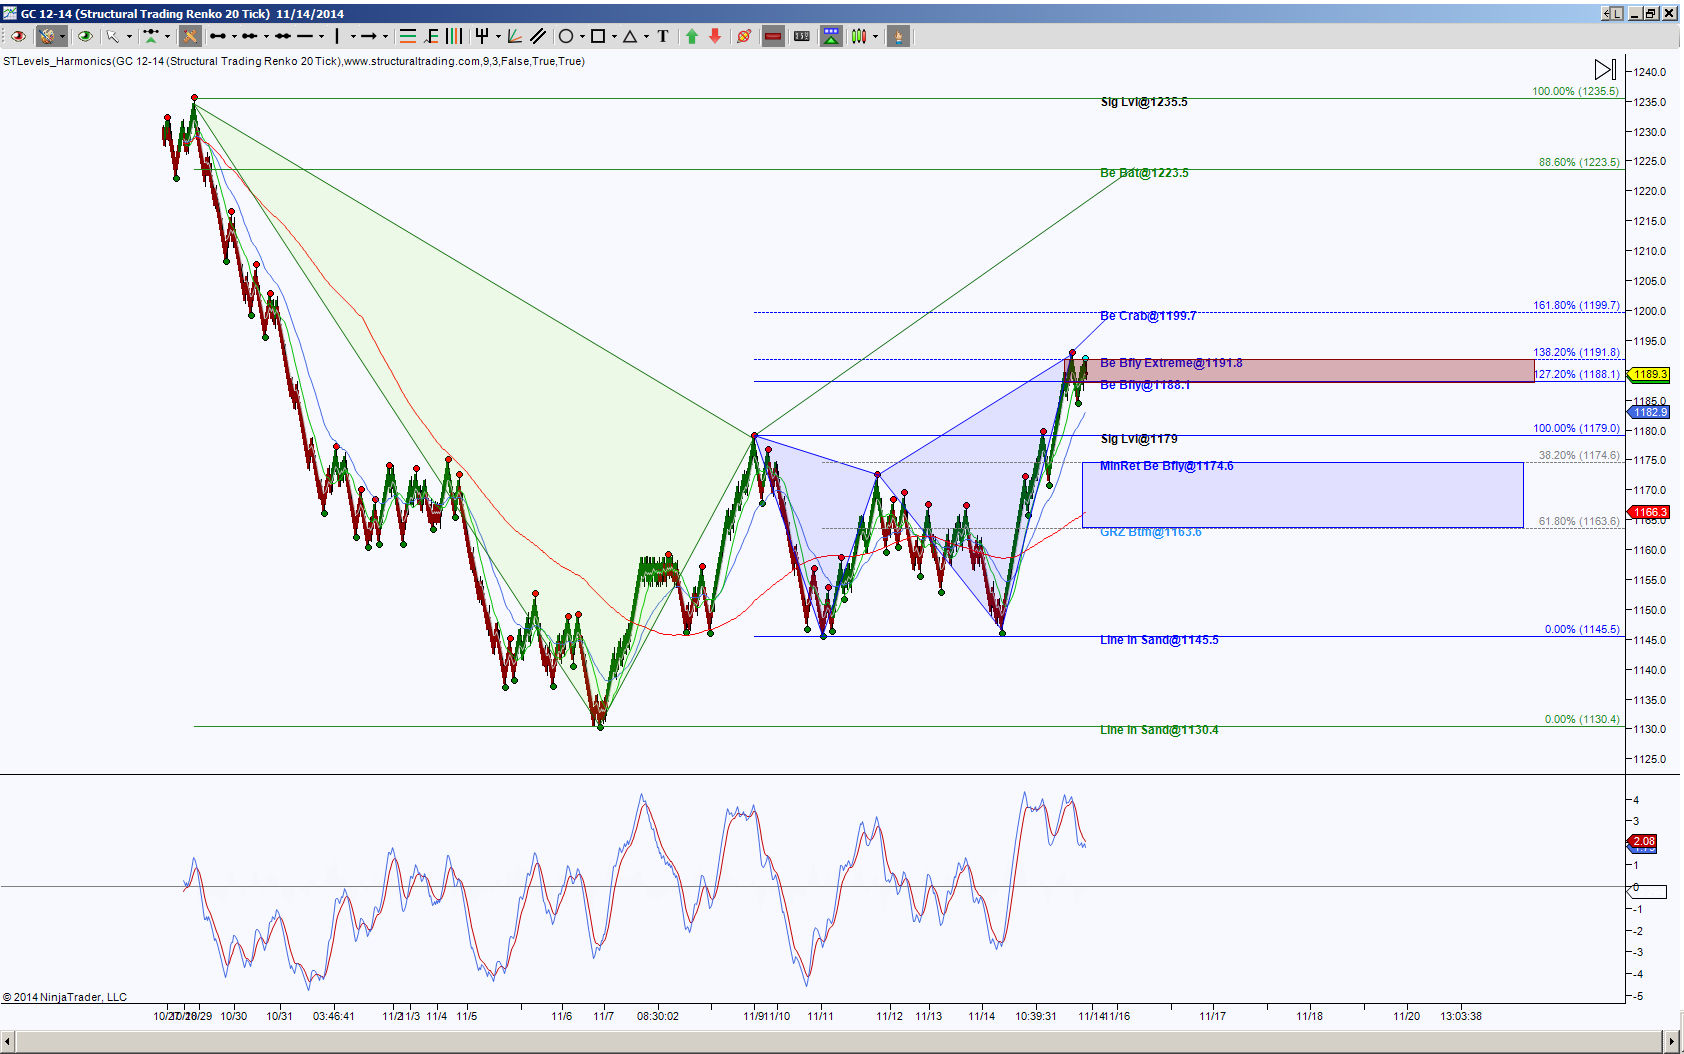
So here we are at a PRZ. If price can hold below 1188.1, the initial pull back target for a support test is 1179, then the GRZ levels of 1174.6 and 1163.6. It’ll be below this juncture that the probability increases of that 100% retracement. A hold above the pull back targets of 1179 or 1174.6 implies there may be some unfinished business at the PRZ so that becomes a retest target. Once price can hold above 1191.8, then the higher targets, also PRZ’s have an increased probability of being tagged.
The initial levels to break and hold from here are the PRZ levels 1191.8 or 1188.1. Once we have that hold beyond the PRZ, then we have a probability bias of whether price will continue to run upwards or retrace.