Harmonic patterns cannot be forced but can enforce risk management trades. Another example of the initial harmonic analysis and how it played out for longer term positions.
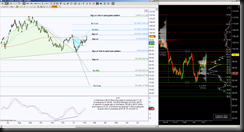
 Let’s start back with the February 8, 2014 post featuring the March contract. On this day chart analysis, I was looking for the initial resistance at 100.86, then harmonic PRZ targets 103.45 and 106.74. At this juncture these PRZ levels are considered targets in route to the line in the sand level 111.20. This is the ideal scenario. Entry opportunity for a long position is with a hold above 100.86 and a short opportunity with a hold below 98.07 to targets 91.35, then 86.78 and PRZ levels 80.14 and 71.69.
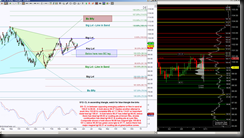
 Now let’s fast forward to the June contract analysis dated May 5, 2014 and updated on May 12th. Here we see that price 103.82 has been holding as resistance and begun to consolidate in triangular formation called an Ascending Triangle. This 103.82 level is approaching that March PRZ for the Bearish Crab, the levels are altered due to contract rollover changes, but the patterns remain the same. At this juncture, we’ve had scaling points from the long position triggered in the March contract. The ideal target is that line in the sand level 109.41 (changed from the March contract level of 111.20). We now also have upside target for a harmonic PRZ labeled Bearish Butterfly (Be Bfly) should that line in the sand fail to hold as resistance. Stops can be adjusted below significant levels that price breaks through and holds above, at the time of this chart, the stops can be below the triangle or the Key Level 98.37.
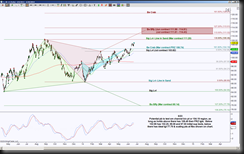
 Present day chart is an August contract and shows price has broken through the initial PRZ target of 106.74 (March) aka 104.19 in this chart. The different contract levels are not placed on the chart to confuse but rather verify that the harmonic levels remain valid even thought there’s a shift in contract price changes. Since CL futures change the contract every month, at this time there have been five rollovers offering price changes, however the harmonic patterns remain intact. So now we see that price is drawing near that line in the sand level 108.46 (it was 111.20 in the March contract), so if you got long above March level 100.86 … let’s say 101 for simplicity purposes, that target of March level 106.74 has been exceeded and it would be the equivalent of entering the August contract long at 98.45 and price is now at 106.82. That’s a nice run with more upside potential providing 104.19 and 102.96 are able to hold as support, that would mean stops would need to be below these levels now to lock in more profit.
