
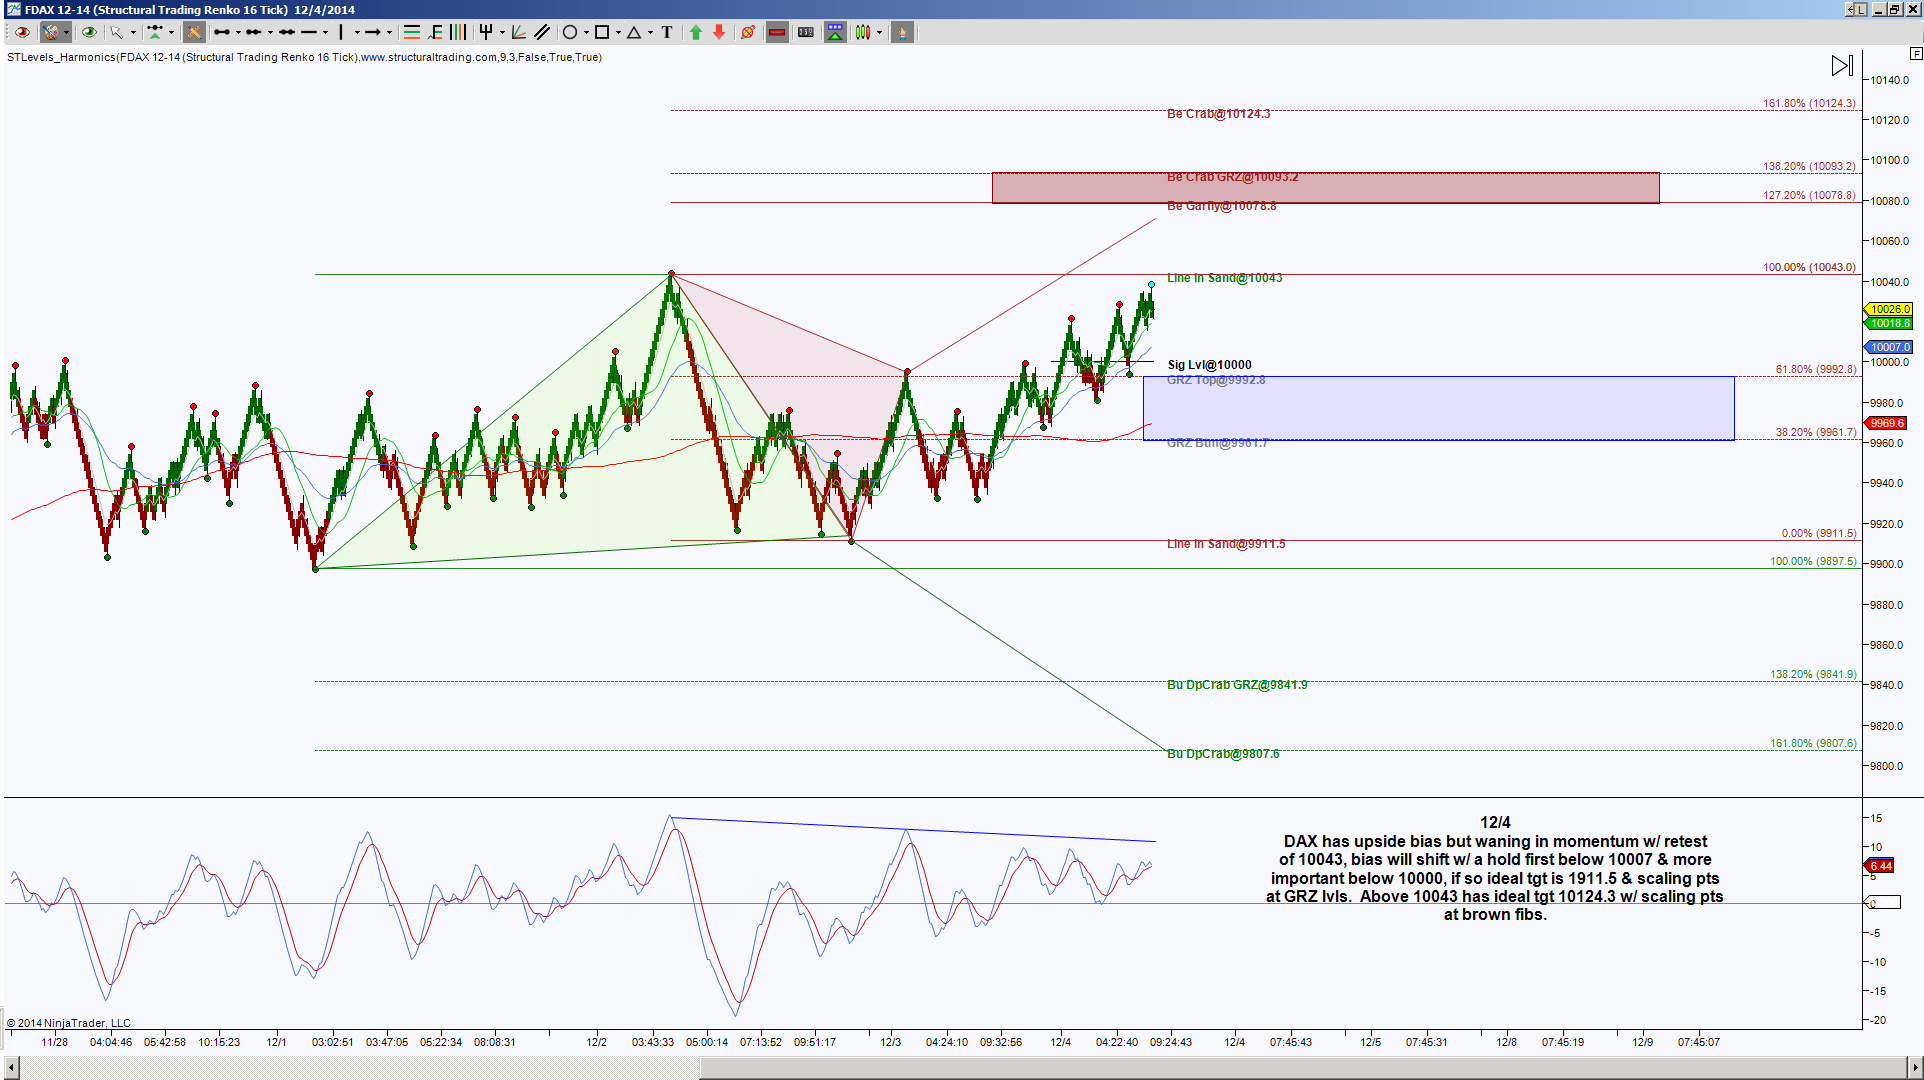
DAX has been beautiful to watch as it creates harmonic patterns that create reversal points. Example in point, last week prior to the US open on December 4, 2014, DAX was approaching an important resistance level of 10043. This was a level where bears had an opportunity to reject, but harmonically speaking, above this level gave targets of 10078.8, 10093.2 and ideally 10124.3. Below is that chart.
By the end of the day, not only did the ideal target of 10124.3 hit, after breaching it a few ticks, it did the job a valid reversal pattern does, it reverses and goes into retracement mode. Every harmonic pattern dreams of retracing 100% or more, yes I realize I’m personalizing it, but I interact with harmonic patterns every day and feel connected with them. Anyway, a 100% retracement target was 9911.5, as you can see from the end of day chart, that target was well exceeded.
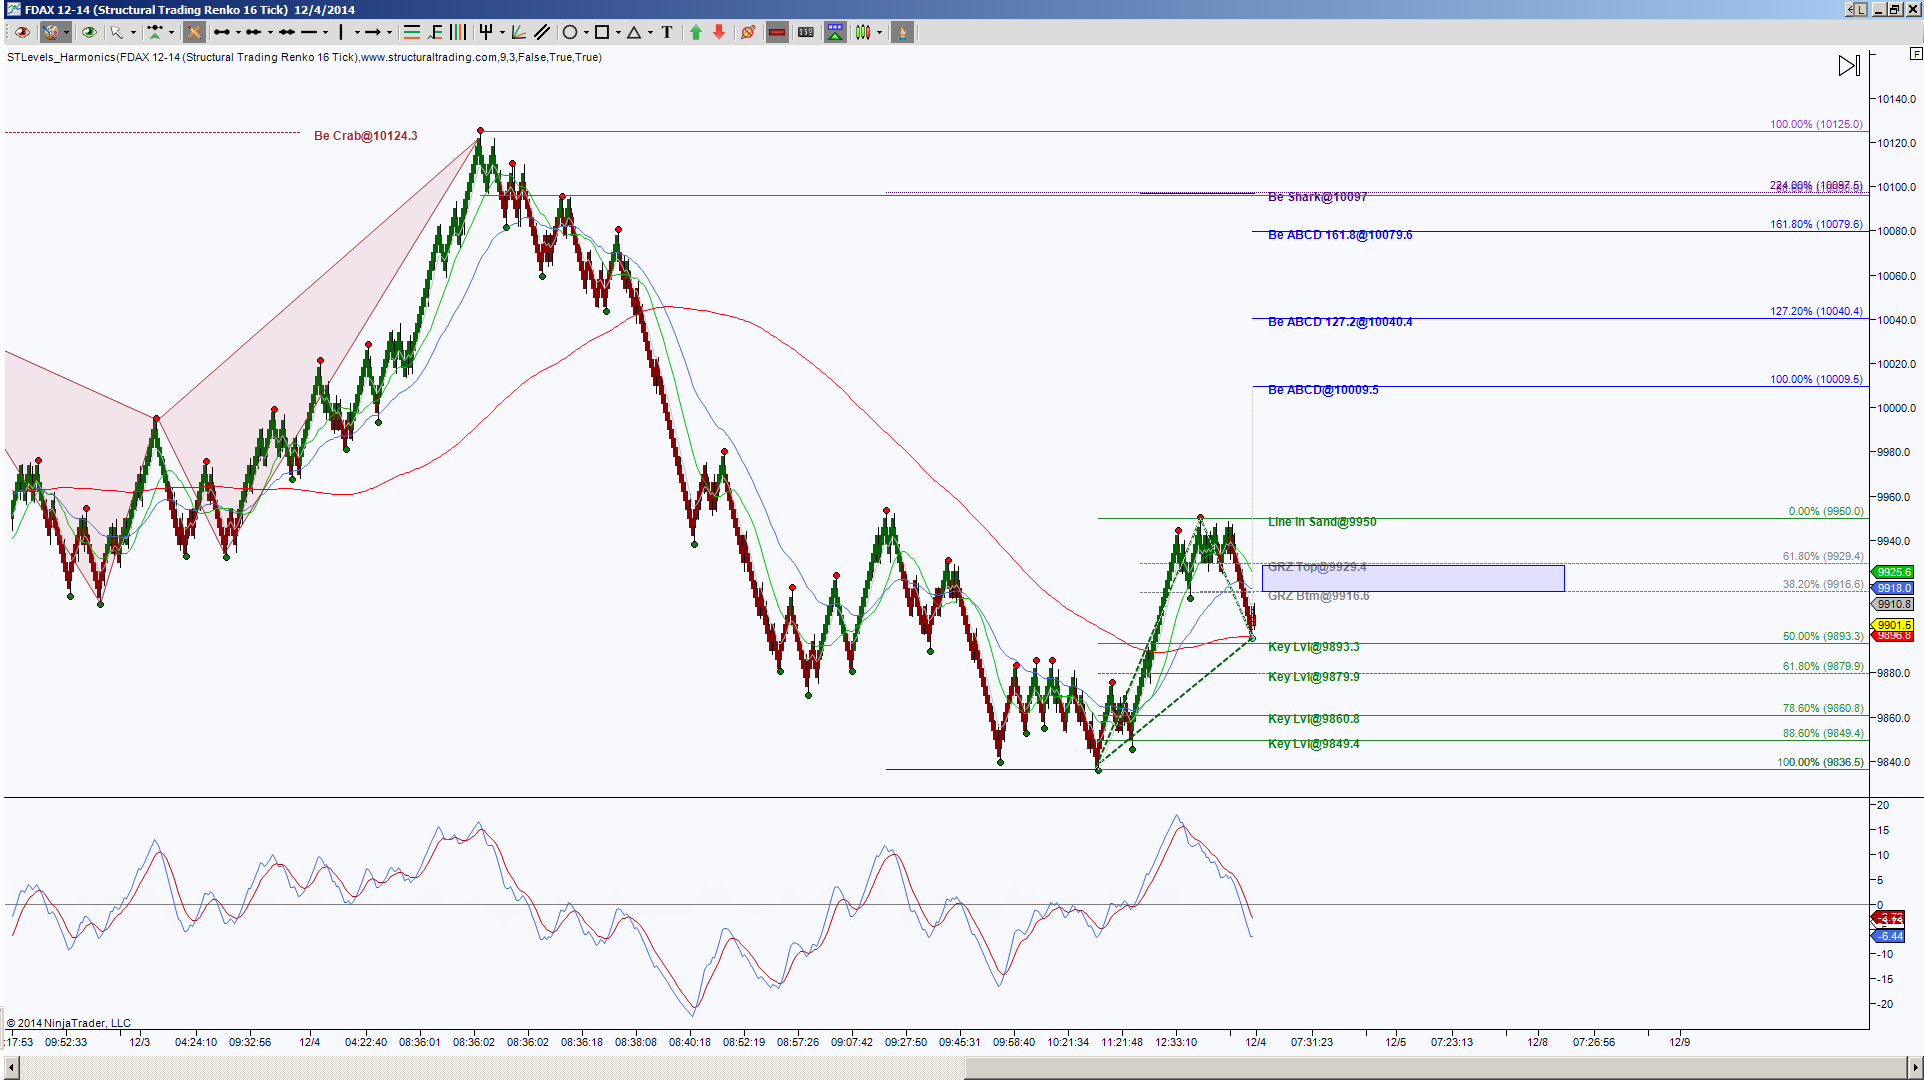
Due to price behavior and harmonic pattern requirements, with an upside move, I was looking for an ideal target of 10100 region for a completion of another harmonic pattern, in this case a Shark. Now using this chart I have an upside target as well as a pullback target from the Shark, being 9999, 9968 and 9836.5. These targets are all derived from this beautiful retracement of a bearish pattern and how it behaved inside that retracement.
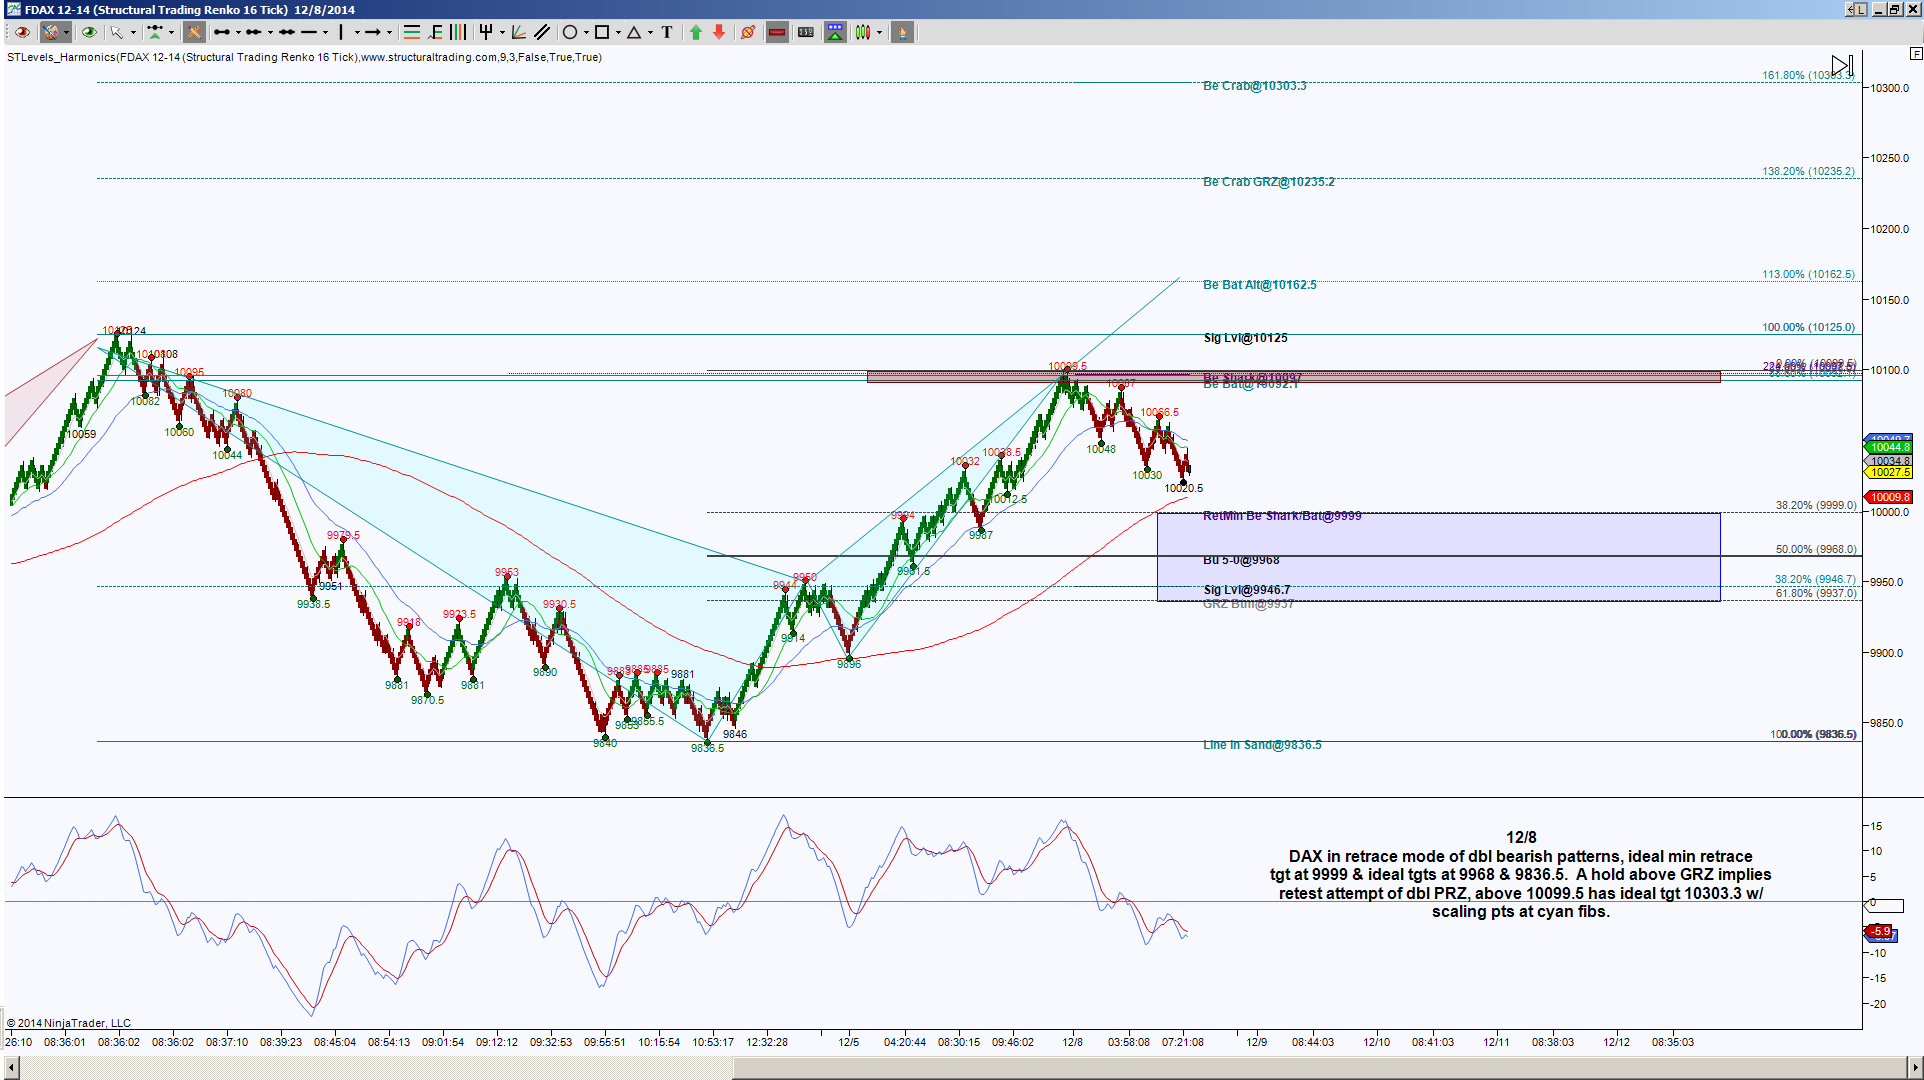
Below is the chart for premarket on Monday, December 8, 2014. Note that price did find its way to the 10100 target region, and it was after this rejection that the probability of reaching those retracement targets increased.
Here we are at current price action, as shown on the chart below. The triangles, the color coordinated Fibonacci’s and Pattern titles, show a lot of information regarding price action and targets. If you’re a harmonic pattern trader, this comment will make sense, “Price retraced a double PRZ to Bullish 5-0 target, there was a breach to complete a small bullish Crab which is now attempting to go into retracement mode however a shallow retracement implies still seeking a triangle point for a new emerging pattern colored brown and that the double bearish patterns are still in retracement mode. A 100% retracement of the small bullish Crab retests the double bearish PRZ, a push above there has the Bat turned into Crab scenario with ideal target at 10303.3 with scaling points at the originating Alternate Bat PRZ and Crab GRZ“. If it sounds like gibberish, see comments below the chart.
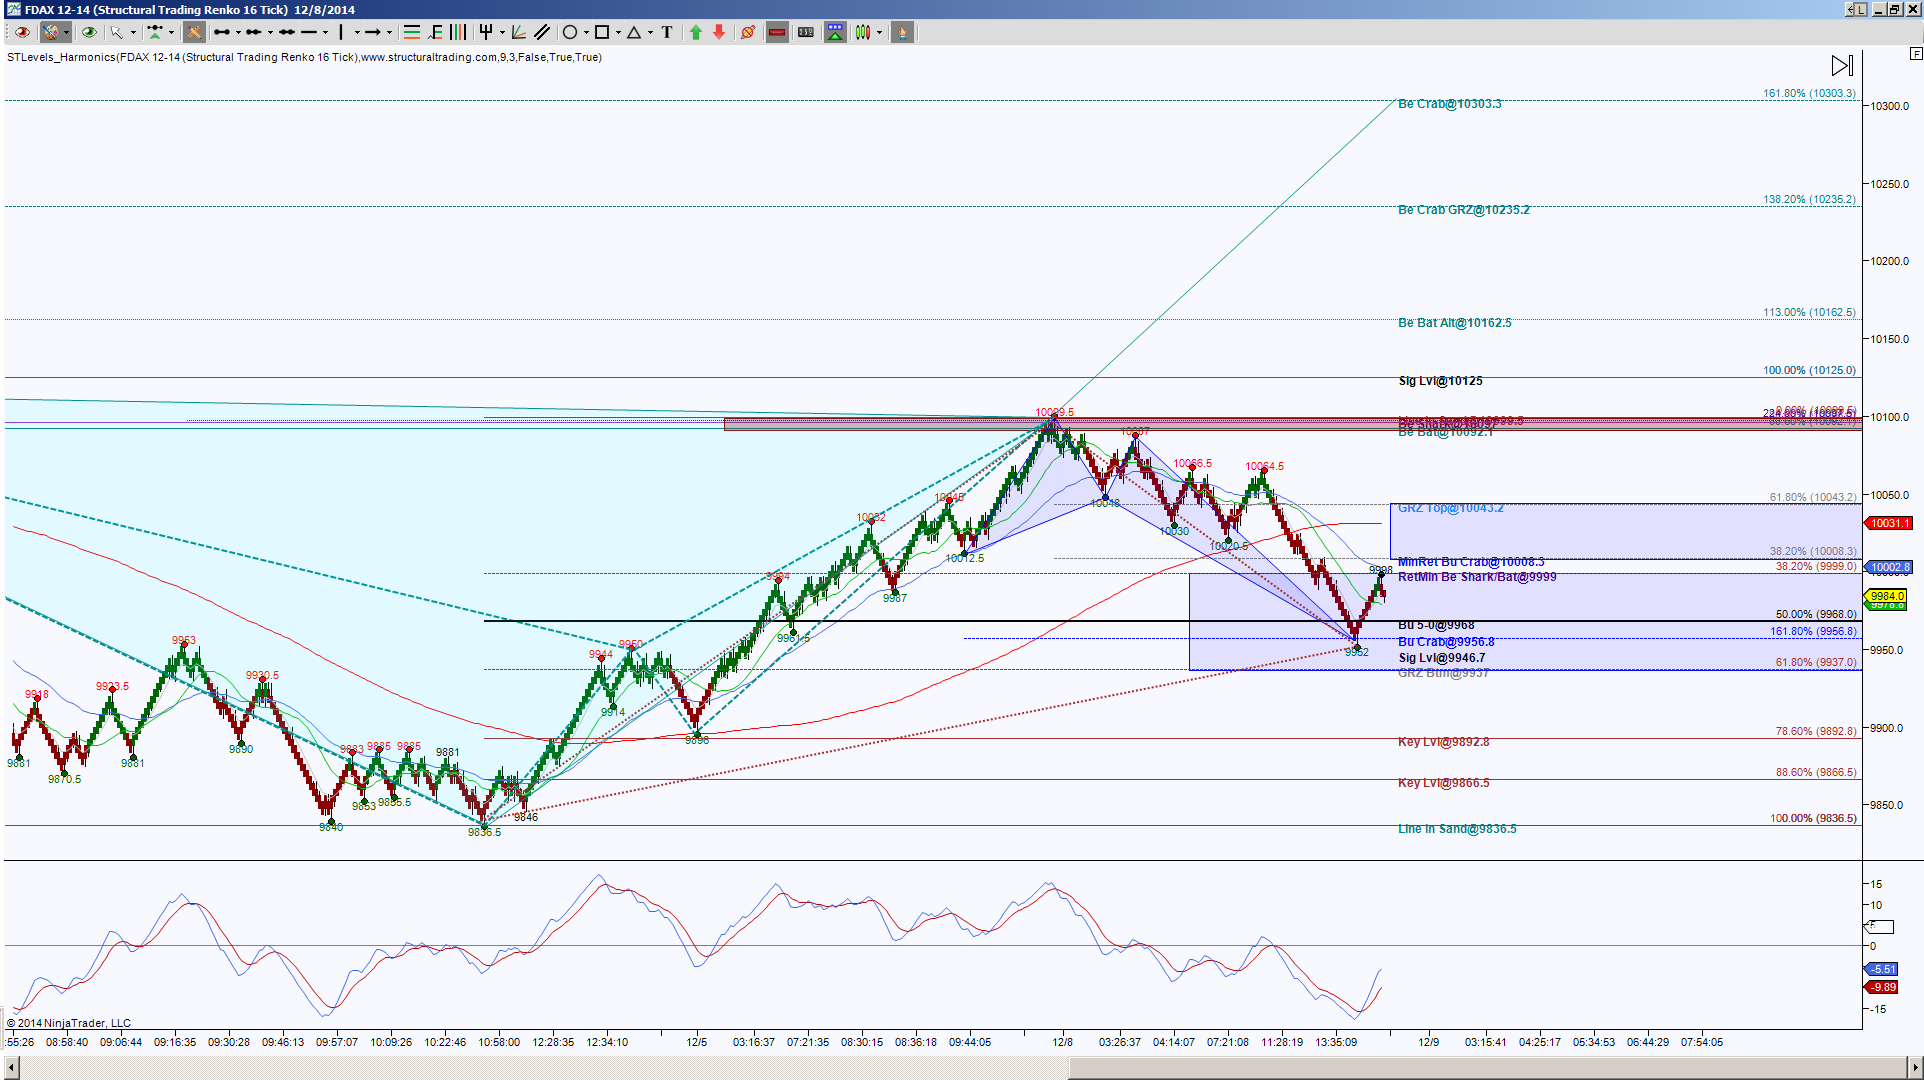
Simply put, what all the harmonic rotations are currently saying is that price is attempting to bounce into resistance at 9999, a potential breach there to tag 10008.3 but as long as price holds below 9999 the bias remains to the downside with the ideal target of 9836.5 and scaling points at the brown fibs. So 9999 is an important level to hold or not in either direction. There is a shift in bias if price can hold above 1008.3, implying a retest of the red zone and points of interest along the way are at 10043.2 and 10065. Above 10099.5 has the ideal upside target of 10303.3 and scaling points at the cyan fibs. So whether you acknowledge harmonic patterns or not, DAX has been moving in harmonic symmetrical moves and what harm would it do to note the target levels if price gets to them?
Trading Futures involves substantial risk & not suitable for all investors. Past performance not indicative of future results.