Skip to primary content
Skip to secondary content

Structural Trading

Building Trading Analysis Through Structure

Structural Trading

Main menu

  • Home
  • Login
  • About
    • A Path To Trading
    • Vision Statement
    • Disclaimer
  • NinjaTrader & Kinetick
  • ST Proprietary Indicators
  • Help
    • Terminology Used in Structural Trading
    • Terminology Videos
    • FAQ
  • Structural Trading Educational Videos

Category Archives: Swing

Post navigation

← Older posts
Newer posts →

Premium Members Harmonic Trading Chart ZB_F

Gallery

Posted on November 10, 2013 by Kathy

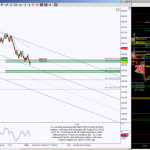
ZBZ13 is in the works of harmonic patterns and the initial observation suggests the recent bounce into 135’19 is indeed a shallow bounce.  One of the great benefits of understanding harmonic patterns is that even though that bounce was shallow, … Continue reading →

Posted in Charts, Education, Patterns, Premium, Swing | Tagged Analysis, Charts, patterns, ZB_F

Premium Members Harmonic Trading Charts for 11/10/2013

Gallery

Posted on November 10, 2013 by Kathy

**Note **  Use these longer timeframe charts throughout the week, intraday charts will be posted daily.  These charts are also setups for swing entries.

Posted in Charts, Education, Patterns, Premium, Swing | Tagged 6E_F, Analysis, Charts, CL_F, DAX_F, ES_F, GC_F, NQ_F, patterns, TF_F, volume profile

Premium Members Minute VS Renko Bars (STRenko Bars to be exact)

Gallery

Posted on November 5, 2013 by Kathy

A dear friend who lives in Poland created a Renko Bar for me to go along with a Fibonacci indicator she also created for me.  I’ve been using a 2 tick Renko Bar chart to fine tune entries and define … Continue reading →

Posted in Charts, Education, Patterns, Premium, Swing | Tagged Analysis, Charts, ES_F, patterns, STRenko

Premium Members Harmonic Trading Charts C and AXP

Gallery

Posted on November 3, 2013 by Kathy

After viewing the financial sector, refer to the XLF post, I decided to look at a couple of stocks inside that sector.  Remember XLF is in a consolidation after completing a large bearish Harmonic pattern.  First let’s look at Citibank … Continue reading →

Posted in Charts, Education, Patterns, Premium, Swing | Tagged Analysis, AXP, C, Charts, patterns, XLF

Premium Members Harmonic Trading Chart XLF

Gallery

Posted on November 3, 2013 by Kathy

  The Financial Sector day chart shows price is in a pullback to test support mode.  There are two important scenarios occurring, first being a very large harmonic pattern, Bearish Crab, has completed at 21.04.  The second being, since the … Continue reading →

Posted in Charts, Education, Patterns, Premium, Swing | Tagged Analysis, Charts, ES_F, patterns, XLF

Premarket and End of Day Harmonic Trading Charts 11/4/13

Gallery

Posted on November 1, 2013 by Kathy

This gallery contains 40 photos.

The end of day charts are the preliminary harmonic analysis for globex and following day’s premarket setups      

Posted in Charts, Education, Patterns, Premarket, Premium, Swing | Tagged 6E_F, Analysis, Charts, CL_F, DAX_F, ES_F, GC_F, NQ_F, patterns, premarket, SPY, TF_F, volume profile

Premium Members Harmonic Trading Charts for 11/3/2013

Gallery

Posted on November 1, 2013 by Kathy

This gallery contains 14 photos.

**Note **  Use these longer timeframe charts throughout the week, intraday charts will be posted daily.  These charts are also setups for swing entries.

Posted in Charts, Education, Patterns, Premium, Swing | Tagged 6E_F, Analysis, Charts, CL_F, DAX_F, ES_F, GC_F, NQ_F, patterns, TF_F, volume profile

Does ES_F & 6J_F Correlate?

Gallery

Posted on October 29, 2013 by Kathy

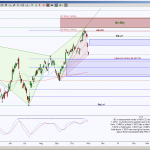
  Some traders like to watch correlation between ESZ13 (S&P Emini futures) and 6JZ13 (Japanese Yen futures).  So let’s take a look at both.  S&P continues to move to the upside with symmetrical pullbacks since the October 2012 bounce off … Continue reading →

Posted in Charts, Education, Patterns, Premium, Swing | Tagged 6J_F, Analysis, Charts, ES_F, patterns

Premium Members Harmonic Trading Chart for SPY

Gallery

Posted on October 26, 2013 by Kathy

Looking at the SPY bigger picture (day chart) and intraday perspective (hour chart) there’s some interesting observations. The day chart shows price has breached a wedge resistance and AB=CD level at 175.08 with some momentum divergence.  A hold above this … Continue reading →

Posted in Charts, Education, Patterns, Premium, Swing | Tagged Analysis, Charts, patterns, SPY

Premium Members Harmonic Trading Chart for DX_F (follow-up)

Gallery

Posted on October 26, 2013 by Kathy

DXZ13 bigger picture scenario was posted in Opening Print Oct 23, 2013 This is the follow up to that analysis by zooming into a smaller timeframe On the left side is the daily perspective, on the right side is an … Continue reading →

Posted in Charts, Education, Patterns, Premium, Swing | Tagged Analysis, Charts, DX_F, patterns

Post navigation

← Older posts
Newer posts →

RESOURCES


MotiveWave

Rancho Dinero's Acme Market Analytics suite is emerging as a leader in innovative market data visualization software for independent traders, market educators and limited partnerships worldwide. Rancho Dinero’s mission is simple – provide unexpectedly fresh, exceptionally clear, top-quality technical analysis products and first-class support at an unparalleled level of value.

Tags

  • 6B_F
  • 6E_F
  • 6J_F
  • AAPL
  • AMZN
  • Analysis
  • AUD/USD
  • BIDU
  • Charts
  • CL_F
  • DAX_F
  • DX_F
  • ES_F
  • EURUSD
  • FB
  • GBPUSD
  • GC_F
  • GLD
  • GOOG
  • IBB
  • IWM
  • Jerry
  • NFLX
  • NG_F
  • NQ_F
  • OptionDawg
  • Options
  • patterns
  • premarket
  • QQQ
  • RTY_F
  • SI_F
  • SPX
  • SPY
  • STBars
  • Swing
  • TF_F
  • TLT
  • Trigger
  • USDJPY
  • videos
  • volume profile
  • VP
  • ZB_F
  • Zones

Meta

  • Register
  • Log in
July 2025
M T W T F S S
 123456
78910111213
14151617181920
21222324252627
28293031  
« Jun    
Proudly powered by WordPress
Content Protected Using Blog Protector By: PcDrome.