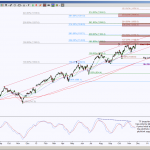
S&P Futures has tested an intraday confluence support at 1785.75. This is the bottom of an uptrend Pitchfork line that correlates with a potential triangle point for an emerging Harmonic Pattern, called Bullish Butterfly. Even though the overall trend is … Continue reading
Category Archives: Swing
Premium Members Harmonic Trading Chart DX_F & Multiple Timeframes
Gallery
Using multiple timeframes for instruments can help keep a trader in a trade and offer clues to tighten position or prepare to exit. The left side of the Dollar index chart is the daily perspective, it shows price is testing … Continue reading
Premium Members Harmonic Trading Chart 6E_F
Gallery
Harmonic patterns typically have a triangle as an important component. The three points of the triangle offer targets, invalidation levels and risk management levels. The 6EZ13 chart shows two triangles, a green and brown one. Based on the guidelines of … Continue reading
Premium Members Harmonic Trading Charts for 11/30/2013
Gallery
**Note ** Use these longer timeframe charts throughout the week, intraday charts will be posted daily. These charts are also setups for swing entries.
Premium Members Harmonic Trading Chart for DX_F
Gallery
Can DX_F commit to reaching a Triple Pattern PRZ? There is a magnet PRZ (potential reversal zone aka Harmonic pattern completion zone) at 77.955 to 77.503 area, however there are obstacles that price must contend with first. The bigger picture … Continue reading
Premium Members Harmonic Trading Chart for ZB_F
Gallery
ZB_F is approaching a very important level regarding opposing emerging patterns. The line in the sand is 128’13. A hold above the line in the sand level keeps price inside the range between 135’19 and 128’13, it also keeps the … Continue reading
Premium Members Harmonic Trading Charts for 11/25/2013
Gallery

This gallery contains 2 photos.
**Note ** Use these longer timeframe charts throughout the week, intraday charts will be posted daily. These charts are also setups for swing entries.
Premium Members Harmonic Trading Charts for 11/17/2013
Gallery
**Note ** Use these longer timeframe charts throughout the week, intraday charts will not be posted daily this week since I am going out of town and will have limited time to commit to intraday analysis. Click here for a … Continue reading
Harmonic Patterns, Beneficial or Intimidating?
Gallery
If I had no knowledge of Harmonic Patterns and saw this ES_F chart, I would raise an eyebrow and have to wonder how this is beneficial to me, in fact, I would most likely find it intimidating and disregard the … Continue reading
Premium Members Harmonic Trading Chart DX_F
Gallery
DXZ13 had a shallow bounce, similar to ZBZ13 but different because US Dollar has implications of upside bias unless price does two things. One, if price fails to push and hold above 81.381 and two, breaks down 80.617. The Dollar … Continue reading
