
Author Archives: Kathy
Premium Harmonic Trading Charts & Premarket Video for 10/16/2013
Gallery
Premium premarket video, click here.
Premarket and End of Day Harmonic Trading Charts 10/14/13
Gallery
This gallery contains 24 photos.
The end of day charts are the preliminary harmonic analysis for globex and following day’s premarket setups
Chart view link has changed Announcment
Gallery
Announcement The link to the room to view the charts has changed. Please click here for the new link.
All Access Harmonic Trading Charts for 10/15/2013
Gallery
Premium Harmonic Trading Charts & Premarket Video for 10/15/2013
Gallery
Premium premarket video, click here.
Premium Harmonic Trading Charts & Premarket Video for 10/14/2013
Gallery
Premium premarket video, click here.
Premium Members Harmonic Trading Charts for 10/13/2013
Gallery
**Note ** Use these longer timeframe charts throughout the week, intraday charts will be posted daily. These charts are also setups for swing entries.
Premium Members Harmonic Trading Chart for SPY
Gallery
SPY is forming a BC leg for a Harmonic Pattern, Bullish Deep Crab, or a potential right shoulder for Head and Shoulders Pattern … or one could look at it that the BC leg is helping form the right shoulder. … Continue reading
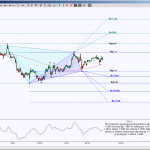
Premium Members Harmonic Trading Chart for HG_F
Gallery
Copper Futures (HGZ13) has an opportunity to complete both opposing Harmonic Patterns. This occurs when the completion of one pattern is within the opposing patterns guidelines to remain valid. The day chart shows price is going sideways, currently holding inside 3.4285 and 3.0145, this … Continue reading