AAPL In Retracement Mode of Daily Bullish Gartley But …
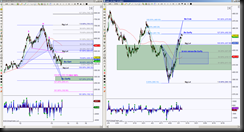
Even though the daily chart currently has lower highs and lower lows, the definition of a downtrend, there is a probability of upside move into resistance as long as price holds above 436.45.
The cause of the probability is threefold:
- One, an attempt to retrace a Bullish Gartley, the ideal minimum retracement target is 507.33 however there is confluence between 489.2 to 493.87 that could prevent the 507.33 test
- Two, the intraday chart completed a Bearish Garfly that has a minimum retracement target of 427.20 but has confluence support test between 436.45 and 437.99
- Three, a daily pullback offers a potential Inverse Head & Shoulder’s right shoulder formation
Interesting that the intraday chart’s scenario to pullback to test significant level 437.99 correlates with daily Gartley PRZ level 436.45 and that the intraday ideal minimum retracement target of 427.20 correlates with a nice region for right shoulder.
Also, intersting that the intraday emerging Bearish Crab (higher probability of unfolding with a hold above 452.38) has a completion target of 470.68, this helps price on daily perspective retest the previous high of 469.95 which is a potential neckline for that Head & Shoulders.
ESM3 In Bull Flag But …
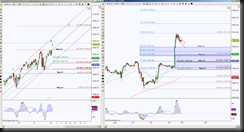
- There are scaling points along the way IF price cannot hold above 1604.75, first scaling point is 1602, then 1599, now this region is confluence of two GRZ’s derived from different rotations, so it becomes a noteworthy support test
- Using 3 different previous pullback ranges, there is one level that all three have a correlating target, 1594 area, this also has confluence with the daily breakout point of 1593 and the two most recent intraday impulsive move retracement targets
- So in a nutshell, 1594 region is a major magnet and if price gets there becomes a very important support test
- HOWEVER if price breakouts of bullflag prior to testing this region, then it lessens the magnetism at this time and 1614.25 becomes the initial important resistance test
- A breakout of 1614.25 has 1664.25 daily target for a third push with scaling points at the intraday extension fibs 1621 and 1629.50

