
The stock charts posted so far this wk have same harmonic scenario if there’s no updated chart. The Day Swordlines for ES, NQ, CL, GC futures & SPY can be refreshed using the STLevels indicator. These charts may just … Continue reading
Daily Archives: February 22, 2016
Premium Preview: Oil Needs Upside Conviction
I like to look at the oil futures for overall view regarding oil stocks. An hour chart of April contract shows price is in a pull back mode to test some convergence support at 33 region. This will be a key level to hold or not to keep an intraday upside bias. In the world of harmonics, ideally I’m looking for upside targets of 37.97 and 40.59 but there are obstacles in route, the initial being 34.21.
Looking at my hour chart, the cyan colored triangle represents the initial phase of an emerging pattern and where price is in relation to the triangle’s midpoint at 34.21 is key, if price can hold above it, it increases the probability of testing 37.97, if holds below it implies an attempt to retest the lower triangle point with a key support test at 31.25, then 29.44 to 29.04 zone.

Trading involves substantial risk and is not suitable for all investors. Past performance is not indicative of future results.
Premium Members Preview: IWM Is Swimming with Sharks

IWM, the ETF for Russell 2000, is swimming in the initial Shark PRZ (Potential Reversal Zone), out of an hour chart’s three potential Sharks.
These are Bearish Shark patterns offering the sellers an opportunity to step in for the retracement mode. Either a breach of 102.22 to test 102.66 then fall back below 102.22 or break down and hold below 100.73 increases the retrace mode scenario and has the initial target of 98.71 and ideal targets at 97.69 for the Bullish 5-0, or 93.37 for the dreamed of 100% retracement of this initial Shark.
Now the 5-0 PRZ offers an opportunity for those buyers that pushed price up to the Shark PRZ’s, to step back in in an attempt to test the higher Shark targets. Once price can hold above 104.23 with conviction, the probability increases to test 113.35.
Keep an eye on the 100.73, the lower portion of the current PRZ, because if price cannot hold below it, this chart’s bias is to the upside implying a test of higher PRZ targets, increasing in that scenario with a hold above 102.22.
An important resistance test of 104.23 is at an interesting juncture since it will be the first time in February that a dominate swing point is taken out, I’m referring to that 103.16 point. It’s interesting because if this extended Shark begins a respectable retracement, it’ll pull price back below 103.16 and I’ll be looking for that 50% retracement for another 5-0 scenario. However if the taking out of the swing point trumps the bearish Shark, then this PRZ between 103.56 and 104.23 was merely a means to an end, in other words, upside scaling points in route to the larger shark at 113.35.
Trading involves substantial risk and is not suitable for all investors. Past performance is not indicative of future results.
Premium Members Preview: Then & Now IYR
Back at October 1, 2015, THEN IYR had completed a bullish pattern, called a Deep Crab, click here for that post. At that time, there was a puny attempt to retrace that bullish pattern. It’s ideal minimum target was 74.11. A good rule of thumb for retracement targets are what I call the Gold Ratio Zone (GRZ), this is the area between 38.2% and 61.8% Fibonacci’s.
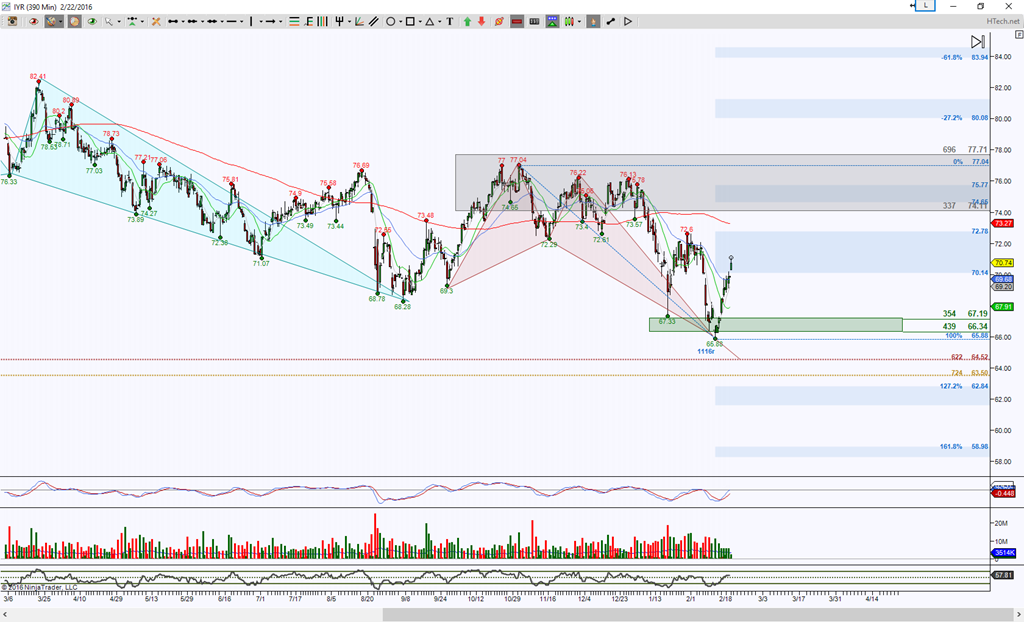
NOW, the day chart shows that after the October 1st post, price did push through the 74.11 target but the gray zone reflects my GRZ top at 77.71 and that did hold price from retracing higher. Once price is inside the GRZ, where it breaks out is a directional bias clue, in this case, it hem hawed around but finally had conviction of breaking down the GRZ 74.11.
Currently price is in a retracement mode of smaller brown colored Butterfly & note that it is inside its GRZ retracement targets 70.14 and 72.78. Again, watch for price to break and hold beyond this GRZ for directional clues. A hold above 72.78 increases probability of testing 77.04 with scaling points at the blue colored levels. A rejection of 72.29 or more important hold below 70.14 has an ideal downside target at a zone that comprises of two separate harmonic pattern completion points, when this occurs it’s called a double bullish PRZ (Potential Reversal Zone aka a harmonic pattern completion target zone) between 64.52 and 63.50. This double PRZ scenario behaves both as a magnet as well as a probable bounce point.
But first things first, which GRZ level can price take out with conviction.
Trading involves substantial risk and is not suitable for all investors. Past performance is not indicative of future results.