
The Day chart shows price is approaching triple bullish PRZ (Potential Reversal zone). This behaves like a magnet AND a very important support zone. The initial test of the PRZ (21.812 to 20.654) could bounce into resistance A shallow bounce … Continue reading
Monthly Archives: May 2013
Premarket & End of Day Charts 5/7/2013
Gallery
Premarket & End of Day Charts 5/6/2013
Gallery
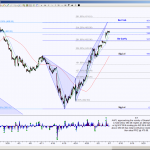
A Detailed Look At AAPL and ES
Gallery
AAPL In Retracement Mode of Daily Bullish Gartley But … Even though the daily chart currently has lower highs and lower lows, the definition of a downtrend, there is a probability of upside move into resistance as long … Continue reading
All Access Charts for 5/6/2013
Gallery
Premium Members Charts for 5/6/2013
Gallery
**Note ** Use these longer timeframe charts throughout the week, intraday charts will be posted daily. These charts are also setups for swing entries.
Premium Charts & Premarket Video for 5/6/2013
Gallery
Premium premarket video, click here.
Premium Charts & Premarket Video for 5/7/2013
Gallery
Premium premarket video, click here.
Premium Charts & Premarket Video for 5/8/2013
Gallery
Premium premarket video, click here.
Premium Charts & Premarket Video for 5/9/2013
Gallery
Premium premarket video, click here.