Structural Trading

Building Trading Analysis Through Structure

Main menu

Skip to primary content
Skip to secondary content
  • Home
  • Login
  • Membership
  • Videos
    • Structural Trading Educational Videos
  • About
    • A Path To Trading
    • Vision Statement
    • Disclaimer
  • Resources
    • NinjaTrader & Kinetick
  • Help
    • Terminology Used in Structural Trading
    • FAQ
  • ST Indicator

Tag Archives: Swing

Post navigation

← Older posts

All Access Harmonic Trading Charts for 8/26/2013

Gallery

Posted on August 25, 2013 by Kathy
Posted in Charts, Education, Patterns | Tagged Analysis, Charts, DAX_F, ES_F, patterns, Swing, TF_F, volume profile

AAPL In Detail

Gallery

Posted on May 27, 2013 by Kathy

    AAPL attempting to retrace a large Bullish Bat, the ideal minimum retracement target being 507.33. A small Inverse Head & Shoulders could help achieve this target.  Failure to get above this small H&S neckline around 463 implies attempt … Continue reading →

Posted in Charts, Education, Patterns, Premium, Swing | Tagged AAPL, Analysis, Charts, patterns, Swing

Does GC_F Have Intraday C Point In?

Gallery

Posted on May 12, 2013 by Kathy

This gallery contains 2 photos.

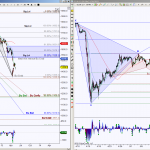
Daily chart shows an attempt to retrace a small Bullish Crab, ideal minimum retracement target is 1526.2 Interesting that the intraday chart has an emerging Bearish Gartley pattern’s completion target 1532.6, this will help the daily pattern have an ideal … Continue reading →

Posted in Charts, Education, Patterns, Premium, Swing | Tagged Analysis, Charts, GC_F, patterns, Swing

OptionDawg Trigger Long MOS

Gallery

Posted on March 28, 2013 by Kathy

Previous 2 days triggered the long signal  

Posted in Charts, Education, Options, Patterns, Premarket, Swing | Tagged Jerry, MOS, OptionDawg, Options, Swing, Trigger

OptionDawg Trigger Long DD

Gallery

Posted on March 25, 2013 by Kathy

DD is triggering for long trade. Trade idea, buy Apr 48 call    

Posted in Charts, Education, Options, Patterns, Premarket, Swing | Tagged DD, Jerry, OptionDawg, Options, Swing, Trigger

OptionDawg Trigger Long BX

Gallery

Posted on March 25, 2013 by Kathy

BX is triggering for long trade. Trade idea, buy Apr 19 call or 19/18bull put for .23  

Posted in Charts, Education, Options, Patterns, Premarket, Swing | Tagged BX, Jerry, OptionDawg, Options, Swing, Trigger

Premium Members Charts for 3/25/2013

Gallery

Posted on March 24, 2013 by Kathy

**Note **  Use these longer timeframe charts throughout the week, intraday charts will be posted daily.  These charts are also setups for swing entries.        

Posted in Charts, Education, Patterns, Premium, Swing | Tagged 6E_F, AAPL, Analysis, Charts, CL_F, DAX_F, DX_F, ES_F, NQ_F, patterns, SPY, Swing, TF_F, volume profile

OptionDawg Trigger Long for CRM Update

Gallery

Posted on March 24, 2013 by Kathy

Click here for the long trigger post Current scenario

Posted in Charts, Education, Options, Patterns, Premium | Tagged Charts, CRM, OptionDawg, Options, patterns, Swing, Trigger

CL (Colgate) long trigger update

Gallery

Posted on March 24, 2013 by Kathy

Click here for Long Trigger post The trigger went off 3/15/13, the next day had one more push to downside, then proceeded to break to upside. Current scenario  

Posted in Charts, Education, Options, Patterns, Premarket, Swing | Tagged Analysis, Charts, CL, Jerry, OptionDawg, Options, patterns, Swing, Trigger

A Closer Look at $ES_F and $DX_F

Gallery

Posted on March 18, 2013 by Kathy

ES completed a Bullish Crab harmonic pattern at 1529.50, this is a reversal pattern that has retraced 78.6%, the great thing about the retracement scenario is price forms a new triangle which gives specific support and resistance levels. With the … Continue reading →

Posted in Charts, Education, Patterns, Premium, Swing | Tagged Analysis, Charts, DX_F, ES_F, patterns, Swing

Post navigation

← Older posts

Custom Indicators

We have our own custom and preferred indicators used in Structural Trading for NinjaTrader & and NinjaTrader 8 & TOS. For more information, please email me at kathy@structuraltrading.com or click the NT Indicator tab.

RESOURCES

UPD

HTTA

Rancho Dinero's Acme Market Analytics suite is emerging as a leader in innovative market data visualization software for independent traders, market educators and limited partnerships worldwide. Rancho Dinero’s mission is simple – provide unexpectedly fresh, exceptionally clear, top-quality technical analysis products and first-class support at an unparalleled level of value.


MotiveWave

Stage 5 Trading

Structural Trading Tweets

  • Happy Thanksgiving week! $ES_F, $NQ_F, $CL_F, $GC_F, $ZB_F harmonic scenarios $$ https://t.co/Y4Z3ZrletI 04:45:49 AM November 25, 2019 from Twitter Web App
  • $ES_F, $NQ_F, $CL_F, $GC_F, $ZB_F harmonic scenarios $$ https://t.co/c7pBT3s18T 05:39:35 AM November 11, 2019 from Twitter Web App
  • $ES_F, $NQ_F, $RTY_F, $CL_F, $GC_F, $ZB_F harmonic scenarios $$ https://t.co/eMtlEIBbM1 01:31:37 PM October 20, 2019 from Twitter Web App
@tbg4321

Tags

  • 6B_F
  • 6E_F
  • 6J_F
  • AAPL
  • AMZN
  • Analysis
  • AUD/USD
  • BIDU
  • Charts
  • CL_F
  • DAX_F
  • DX_F
  • ES_F
  • EURUSD
  • FAS
  • FB
  • GBPUSD
  • GC_F
  • GLD
  • GOOG
  • GOOGL
  • IBB
  • IWM
  • Jerry
  • NFLX
  • NG_F
  • NQ_F
  • OptionDawg
  • Options
  • patterns
  • premarket
  • QQQ
  • RTY_F
  • SI_F
  • SPX
  • SPY
  • STBars
  • Swing
  • TF_F
  • TLT
  • Trigger
  • USDJPY
  • videos
  • volume profile
  • ZB_F

Meta

  • Register
  • Log in
December 2019
M T W T F S S
« Nov    
 1
2345678
9101112131415
16171819202122
23242526272829
3031  

Disclaimer

Structural Trading is not an investment adviser, nor a securities broker. Information shared here is intended for educational purposes only. All methods, techniques, indicators and setups shared by Structural Trading are not a guarantee of success or profit. Futures and Forex trading contains substantial risk and is not for every investor. An investor could potentially lose all or more than the initial investment. Risk capital is money that can be lost without jeopardizing ones’ financial security or life style. Only risk capital should be used for trading and only those with sufficient risk capital should consider trading. Past performance is not necessarily indicative of future results. Hypothetical performance results have many inherent limitations, some of which are described below. No representation is being made that any account will or is likely to achieve profits or losses similar to those shown; in fact, there are frequently sharp differences between hypothetical performance results and the actual results subsequently achieved by any particular trading program. One of the limitations of hypothetical performance results is that they are generally prepared with the benefit of hindsight. In addition, hypothetical trading does not involve financial risk, and no hypothetical trading record can completely account for the impact of financial risk of actual trading. for example, the ability to withstand losses or to adhere to a particular trading program in spite of trading losses are material points which can also adversely affect actual trading results. There are numerous other factors related to the markets in general or to the implementation of any specific trading program which cannot be fully accounted for in the preparation of hypothetical performance results and all which can adversely affect trading results. It is advised to NEVER follow a trade setup blindly, but rather always understand why a trade is entered and have risk management defined before entering a trade. Structural Trading will never share or sell personal information of members.
Proudly powered by WordPress
Content Protected Using Blog Protector By: PcDrome.
s2Member®