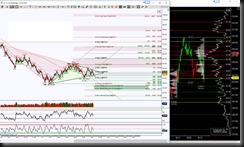
If you’re familiar with the Beverly Hillbillies, you know their theme song referred to oil as Black Gold, Texas Tea. Oil futures Day chart is testing the bottom of a triangular formation which just happens to be inside a green colored GRZ (Golden Ratio Zone, aka the area between 38.2% and 61.8% Fibonacci’s.) There is a potential dip below the triangle to test 41.98 or even 40.51 but downside continuation has an ideal target of 29.11 with points of interest along the way at noted levels.
When price is inside a consolidation, whether it be a triangle or rectangle, in this case it is both, price can easily breakout in either direction so it’s best to always be prepared for opposite of your initial bias. The markets lead the retail traders, the retail traders do not lead the markets. However, harmonic patterns offer targets, risk parameters and probability edge. But back to being prepared for all scenario’s, should price be able to hold above 46.62, there is an initial obstacle for a resistance test at 50.8, but above there increases probability of playing out the brown Bat at 72.36.
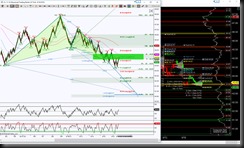
For an intraday perspective, I’m using an STRenko 30 bar chart and utilizing both hpcollection and stzones tools. The green zone represents a harmonic pattern completion but failure to retrace the Gartley pattern when attempted to hold above the PRZ twice implied price was to test the beginning point of the triangle at 43.61, labelled Line In Sand. Currently that 43.61 is the important support test and the top of PRZ 44.62 is an important resistance test.
Above the PRZ increases the probability of retrace mode with an important target at 45.33, which will help the Day chart test the top of its green GRZ. Below the Line in Sand level 43.61 increases the probability of completing the larger blue Crab pattern at 40.68, which will help the Day chart level of 40.51 be tested, with scaling points at green or noted levels.
The intraday chart has downside bias unless price can hold back above 45.33 but keep in mind wherever price can break and hold beyond the PRZ will offer the initial directional bias, which will increase in that scenario with momentum backing it.
Trading involves substantial risk and is not suitable for all investors. Past performance is not indicative of future results.
By Kathy Garber
Harmonic Trader Contributor
Founder Structuraltrading.com


