Click here for previous update derived from short trigger.
Since that update, the ultimate short trigger profit was the bottom of the red pitchfork shown on the daily chart.
Here is the current scenario
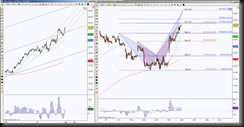
Daily chart shows price pulled back to test confluence support at 22.11, inside two uptrending Pitchforks. Intraday chart shows price is approaching one of two Bearish Crab PRZ’s (Potential Reversal Zone aka Completion Targets)
- Intraday chart (39 min) suggests potential pullback to test 23 support region.
- Ideal minimum retracement target for the brown Bearish Crab is around 22.75, so if 23 level fails to hold price up, the next significant support test is 22.75.
- This potential pullback shown on intraday chart correlates with Daily pullback target of double Pitchfork lines.
- A hold above 23 or above 23.31 has the larger (blue) Bearish Crab PRZ target at 23.70 with scaling point at 23.43.
- Daily chart implies bullish bias, watch how price behaves at the two different pitchfork lines.

