As a child watching the original Twilight Zones, Hitchcock, etc, 2014 was considered a futuristic realm, yet here we are.
The US markets continued to make higher highs in 2012 with many thinking, “It just can’t keep going up”. It’s been a Bull’s delight and a Bear’s frustration. Harmonic Pattern traders have seen bearish pattern complete and have minimal retracement which is always a clue of upside continuation, or invalidation of bearish patterns. As stated before, sometimes Harmonic Pattern PRZ’s (Potential Reversal Zone’s) are Notify Users About this Postmerely targets en route to bigger higher levels.
Today I was asked to give my view how 2013 would close and the projections of 2014. I’m the type of trader that says “IF price does this, THEN such and such is the target”, I evolved into this type of a mind frame after the market humbled me for having predictions, sometimes violently. Failure to have bias liquidity in the markets can lead to stubbornness, which can domino into revenge trading (getting in a trade with the mindset of “I’ll show you”), fantasy trading (wishing a scenario wasn’t true), or white flag trading (the I give up and don’t care attitude, so will let a trade go into a huge loss rather than honoring a stop loss).
Back to the opinions I have of S&P 500 for 2014. My opinions are not based on the economy, politics or world news, they are based off the chart’s technical analysis. I just interpret what I see in the price action and the symmetry, and here’s what I conclude.
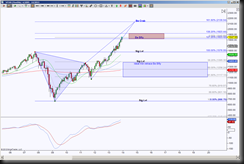
 Looking at the SPX monthly chart, it’s indeed in a bearish PRZ, meaning that IF price holds below this zone, THEN it implies an attempt to go into retracement mode. This is not a declaration of market reversal, it is merely an observation that offers a short opportunity to specified targets when the short signals are triggered. The other scenario here is that price can still go higher and remain inside this bearish PRZ, and it’s not until IF price can hold above the PRZ, that THEN it implies upside continuation to higher targets.
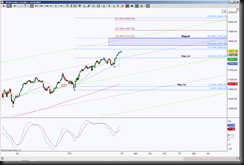
 Going to the next timeframe down, the day chart, an uptrend pitchfork channel since 2012 and all through 2013 has been an upside bias guideline. Actually, since April 2013, price began to hold above the pitchfork’s midline which is the half way mark of the high and low of the channel. And now price is, for the first time since the channel formed, is holding above the three-quarter mark. So this interpretation states there’s a potential pullback to test the three-quarter mark at 1828 to 1813.50 region as support, and how price behaves IF this pullback occurs, THEN there’s a magnet target of 1916 to 1917 area.
Now this magnet of 1916 to 1917 is still inside the bearish PRZ on the monthly timeframe, so this confluence of resistance shown on the daily chart could prevent price from testing the extreme of the monthly PRZ target of 1923.44.
However, let’s not rule out the possibility of price completing the monthly target of 2138 for a Harmonic Pattern completion, whether it be a walk along the pitchfork resistance line or a break above it. Simply put, a hold above 1923.44 has the upside target of 2138 and that confluence resistance test on the daily chart was merely a stepping stone to a higher plateau. Keep in mind also, that the stronger a confluence is at a leve, the higher the probability of being a rejection point, and when it’s not rejected, then the break of it is that much more impressive.
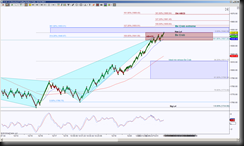
 And finally, an intraday perspective comes from an STRenko bar chart that is comparable to a 15 to 30 minute timeframe. This chart tells me that price is testing the immediate extreme of a PRZ for a Bearish Crab Harmonic Pattern, at 1847, that price has tested all levels inside of this red zone. I’m showing end of day chart and the view is that IF price holds below 1847, THEN the maximum extreme target for the Crab is 1853.5, could stretch to 1855.50, but failure to retrace from there is a big statement for the bulls.
A hold below 1846.50 implies a test of the bottom of the PRZ at 1837.50, a break down there implies an attempt to go into retracement mode with the ideal minimum retracement target at 1811.25, the stronger the reversal pattern is, the more it will retrace, really strong reversal patterns like to retrace 100% or more. A 100% retracement would take price back to 1754.
What will 2014 bring? I’ll be watching the IF’s and THEN’s. Here’s wishing you the best of the new year and that you’re on the right side of the trade more often than not!
