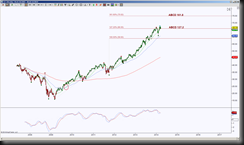
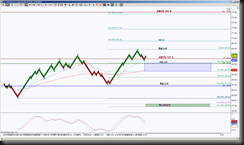
The ETF for the Consumer Discretionary Select Sector has been in an uptrend since 2009, currently price is stalling at a harmonic pattern level. The longer term timeframe chart, I’m using the Weekly, is testing a very large ABCD 127.2% Harmonic Pattern PRZ, with some momentum divergence. The intraday chart shows a fine tuned view how price is behaving at that PRZ.
 The weekly chart shows price is stalling at 66.05, this is the ABCD 127.2 PRZ, a pullback into support has the initial target of 65.12 for a bullish cross validation test, this test offers a long opportunity for upside continuation if it holds price up, if not then the next target for a support test is 60.79.
 The intraday chart, I’m using an STRenko 40 bar chart, shows price is in between opposing emerging harmonic patterns, this is a result of stalled price.
It’s always interesting to me how smaller harmonic scenarios help larger ones. In this case, the weekly ABCD 127.2 and ABCD 161.8 levels are shown in brown lines at 66.05 and 75.02 and the weekly pull back targets of 65.12, noted in green and 60.79 which is noted in blue.
So the smaller scenario is price is in pullback mode with a harmonic requirement target of 65.24 (see how this correlates with the weekly target of 65.12?), a break down there has the ideal target of 56.82 and scaling points or potential rejection levels at the green Fibonacci ratios. Note how the Significant level of 61.03 correlates with the second pullback target of 60.79.
A hold above 67.85 has the ideal target at the weekly ABCD 161.8 target at 75.02, but the intraday chart has points of interest along the way, namely 69.45, 71.74 and 74.65, which of course correlates with the weekly target.
How long can an instrument, sector, or market stay in a trend? Until it tells us otherwise. The bigger picture scenario implies the uptrend stays in tact as long as price stays above 60.79. So should price complete the harmonic pattern labelled as Bu Shark (Bullish Shark) at 57.36, this would be a caution alert for long positions.
Since the Shark is a bullish pattern, a bounce there would have that 60.79 as an important resistance test and that would be a clear signal whether it holds or not.
That’s looking to an extreme, I realize, and it’s very well a possibility that the 60.79 won’t be tested, but wouldn’t you rather have a plan if price gets there?
