
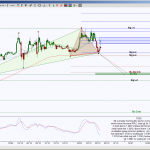
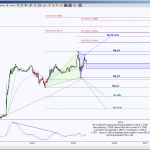
DXZ13 bigger picture scenario was posted in Opening Print Oct 23, 2013 This is the follow up to that analysis by zooming into a smaller timeframe On the left side is the daily perspective, on the right side is an … Continue reading
Blog Archives
All Access Harmonic Trading Charts for 10/28/2013
Gallery
Premium Members Harmonic Trading Charts for 10/27/2013
Gallery
**Note ** Use these longer timeframe charts throughout the week, intraday charts will be posted daily. These charts are also setups for swing entries.
Premarket and End of Day Harmonic Trading 10/25/13
Gallery
This gallery contains 28 photos.
The end of day charts are the preliminary harmonic analysis for globex and following day’s premarket setups
Premarket and End of Day Harmonic Trading Charts 10/24/13
Gallery
This gallery contains 24 photos.
The end of day charts are the preliminary harmonic analysis for globex and following day’s premarket setups
All Access Harmonic Trading Charts for 10/25/2013
Gallery
Premium Harmonic Trading Charts & Premarket Video for 10/25/2013
Gallery
Premium premarket video, click here.
All Access Harmonic Trading Charts for 10/24/2013
Gallery
Premium Harmonic Trading Charts & Premarket Video for 10/24/2013
Gallery
Premium premarket video, click here.
Premarket and End of Day Harmonic Trading Charts 10/23/13
Gallery
This gallery contains 32 photos.
The end of day charts are the preliminary harmonic analysis for globex and following day’s premarket setups