
Premium premarket video, clickhere.
Blog Archives
Premarket and End of Day Charts 1/30/14
Gallery
This gallery contains 32 photos.
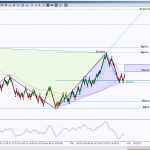
The left chart is current day’s premarket chart with analysis notes, the end of day charts are the preliminary harmonic analysis for globex and following day’s premarket setups For Left chart premarket video, click here
Premium Harmonic Trading Charts & Premarket Video for 1/30/2013
Gallery
Premium premarket video, clickhere.
Premarket and End of Day Charts 1/29/14
Gallery
This gallery contains 34 photos.
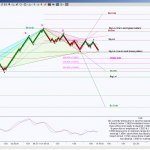
The left chart is current day’s premarket chart with analysis notes, the end of day charts are the preliminary harmonic analysis for globex and following day’s premarket setups For Left chart premarket video, click here
Premium Harmonic Trading Charts & Premarket Video for 1/29/2013
Gallery
Premium premarket video, click here.
Premarket and End of Day Charts 1/28/14
Gallery
This gallery contains 30 photos.
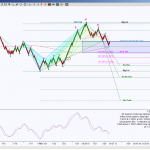
The left chart is current day’s premarket chart with analysis notes, the end of day charts are the preliminary harmonic analysis for globex and following day’s premarket setups For Left chart premarket video, click here … Continue reading
All Access Harmonic Trading Charts for 1/28/2014
Gallery
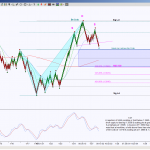
S&P Cash Update
Gallery
Will the daily Harmonic Patterns help the monthly Harmonic Pattern play out? A previous SPX post described how the monthly chart of SPX was testing a bearish Butterfly PRZ (Potential Reversal Zone aka a harmonic pattern’s completion target zone). That … Continue reading
Premium Harmonic Trading Charts & Premarket Video for 1/28/2013
Gallery
Premium premarket video, click here.
Premarket and End of Day Charts 1/27/14
Gallery
This gallery contains 32 photos.
The left chart is current day’s premarket chart with analysis notes, the end of day charts are the preliminary harmonic analysis for globex and following day’s premarket setups For Left chart premarket video, click here