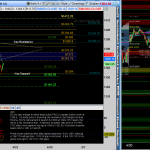
**Note ** Be aware of intraday price at one of these levels. The volume profile zones are good throughout the week, with the exception of potential change of color of a zone, ie: if price is above a red zone, … Continue reading
Tag Archives: SPX
Premium Members Harmonic Trading Charts for 1/5/2015
Gallery
**Note ** Be aware of intraday price at one of these levels. The volume profile zones are good throughout the week, with the exception of potential change of color of a zone, ie: if price is above a red zone, … Continue reading
Premium Preview of: S&P 500 Testing Inverse H&S Neckline
Gallery
The S&P 500 Day chart, on the left, shows price is in between an inverse Head & Shoulders neckline and a Significant Level at 2079.46. These being the initial levels to break and hold to increase the probability of … Continue reading
SPX Wedged On Multiple Perspectives
Gallery
SPX has been in an uptrending move since June 4, 2012. Currently price is forming a wedge on the day chart, this is derived from higher highs and higher lows but in a contraction formation. Interesting that an intraday perspective … Continue reading
SPX Forming Third of Four Harmonic Legs
Gallery
Recently I posted a harmonic analysis on SPX which showed the monthly perspective testing a bearish PRZ (Potential Reversal Zone aka a region or zone where a harmonic pattern completes) and a daily perspective of price attempting to form the … Continue reading
S&P Cash Update
Gallery
Will the daily Harmonic Patterns help the monthly Harmonic Pattern play out? A previous SPX post described how the monthly chart of SPX was testing a bearish Butterfly PRZ (Potential Reversal Zone aka a harmonic pattern’s completion target zone). That … Continue reading
Premium Members SPX
Gallery
SPX is testing a monthly bearish Harmonic Pattern PRZ (Potential Reversal Zone). This zone is from 1823.42 to 1923.44 and currently price is holding inside the zone. As long as price holds inside the zone it implies an attempt to … Continue reading
Welcome to 2014
Gallery
As a child watching the original Twilight Zones, Hitchcock, etc, 2014 was considered a futuristic realm, yet here we are. The US markets continued to make higher highs in 2012 with many thinking, “It just can’t keep going up”. It’s … Continue reading

