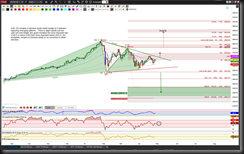
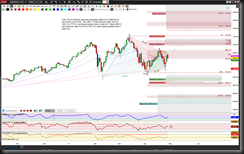
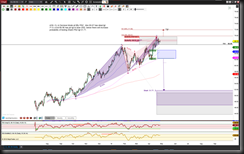
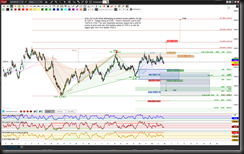
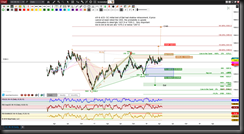
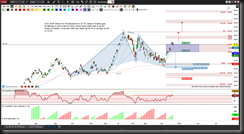
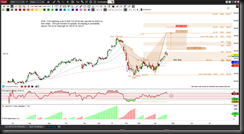
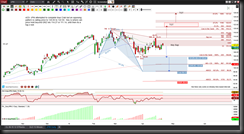
Disclaimer: Structural Trading is not an investment adviser, nor a securities broker. Information shared here is intended for educational purposes only. All methods, techniques, indicators and setups shared by Structural Trading are not a guarantee of success or profit. … Continue reading
Tag Archives: SPX
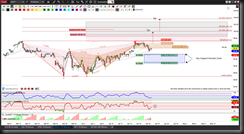
Harmonic Scenarios for Wk of 6/11/18
Gallery
Disclaimer: Structural Trading is not an investment adviser, nor a securities broker. Information shared here is intended for educational purposes only. All methods, techniques, indicators and setups shared by Structural Trading are not a guarantee of success or profit. Futures … Continue reading
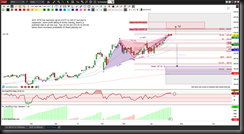
Harmonic Scenarios for Wk of 6/4/18
Gallery
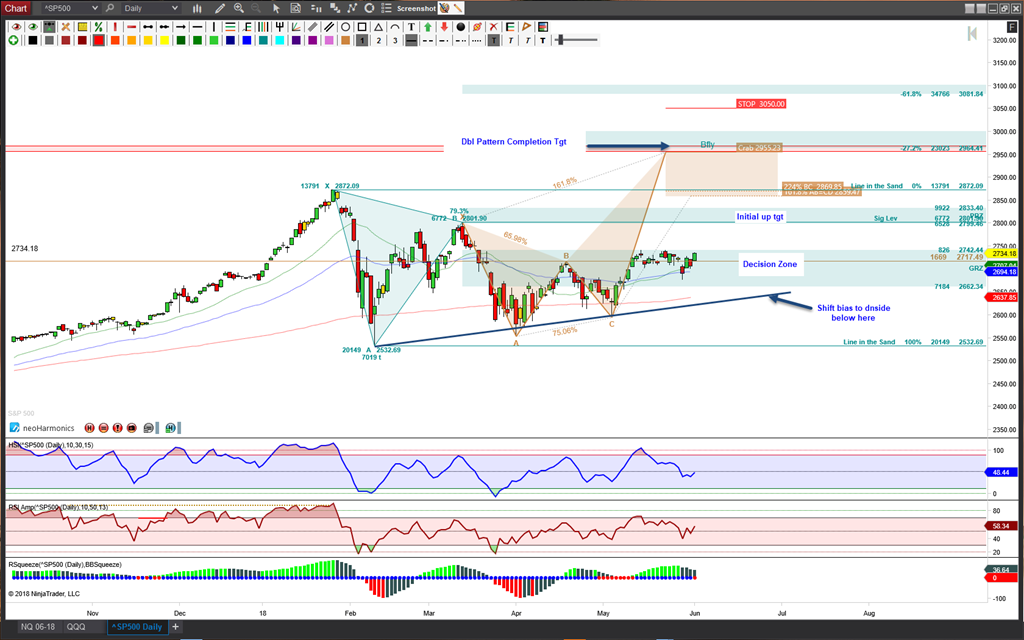
This gallery contains 10 photos.
Disclaimer: Structural Trading is not an investment adviser, nor a securities broker. Information shared here is intended for educational purposes only. All methods, techniques, indicators and setups shared by Structural Trading are not a guarantee of success or profit. Futures … Continue reading
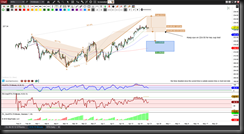
Harmonic Scenarios for Week of 4/30/18
Disclaimer:
Structural Trading is not an investment adviser, nor a securities broker. Information shared here is intended for educational purposes only.
All methods, techniques, indicators and setups shared by Structural Trading are not a guarantee of success or profit.
Futures and Forex trading contains substantial risk and is not for every investor. An investor could potentially lose all or more than the initial investment. Risk capital is money that can be lost without jeopardizing ones’ financial security or life style. Only risk capital should be used for trading and only those with sufficient risk capital should consider trading. Past performance is not necessarily indicative of future results.
Hypothetical performance results have many inherent limitations, some of which are described below.
No representation is being made that any account will or is likely to achieve profits or losses similar to those shown; in fact, there are frequently sharp differences between hypothetical performance results and the actual results subsequently achieved by any particular trading program. One of the limitations of hypothetical performance results is that they are generally prepared with the benefit of hindsight. In addition, hypothetical trading does not involve financial risk, and no hypothetical trading record can completely account for the impact of financial risk of actual trading. for example, the ability to withstand losses or to adhere to a particular trading program in spite of trading losses are material points which can also adversely affect actual trading results. There are numerous other factors related to the markets in general or to the implementation of any specific trading program which cannot be fully accounted for in the preparation of hypothetical performance results and all which can adversely affect trading results.
It is advised to NEVER follow a trade setup blindly, but rather always understand why a trade is entered and have risk management defined before entering a trade.
Structural Trading will never share or sell personal information of members.
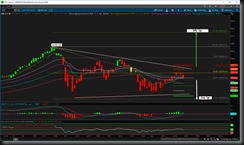
Harmonic Scenarios for Week of 4/23/18
Disclaimer:
Structural Trading is not an investment adviser, nor a securities broker. Information shared here is intended for educational purposes only.
All methods, techniques, indicators and setups shared by Structural Trading are not a guarantee of success or profit.
Futures and Forex trading contains substantial risk and is not for every investor. An investor could potentially lose all or more than the initial investment. Risk capital is money that can be lost without jeopardizing ones’ financial security or life style. Only risk capital should be used for trading and only those with sufficient risk capital should consider trading. Past performance is not necessarily indicative of future results.
Hypothetical performance results have many inherent limitations, some of which are described below.
No representation is being made that any account will or is likely to achieve profits or losses similar to those shown; in fact, there are frequently sharp differences between hypothetical performance results and the actual results subsequently achieved by any particular trading program. One of the limitations of hypothetical performance results is that they are generally prepared with the benefit of hindsight. In addition, hypothetical trading does not involve financial risk, and no hypothetical trading record can completely account for the impact of financial risk of actual trading. for example, the ability to withstand losses or to adhere to a particular trading program in spite of trading losses are material points which can also adversely affect actual trading results. There are numerous other factors related to the markets in general or to the implementation of any specific trading program which cannot be fully accounted for in the preparation of hypothetical performance results and all which can adversely affect trading results.
It is advised to NEVER follow a trade setup blindly, but rather always understand why a trade is entered and have risk management defined before entering a trade.
Structural Trading will never share or sell personal information of members.
Premium Harmonic Intraday Trading Charts for 12/22/2015
Gallery
This is a short week due to Christmas holiday. Updated intraday charts will only be posted for Monday, Tuesday & Wednesday. Enjoy your family and friends, Happy Holidays! I’m having some technical issues w/ some of my STHarmonic levels showing … Continue reading
Premium Members Preview: SNP Snps At Neutrality
Gallery
S&P500 Day chart shows price is snipping away between range bound levels. Ideally the bulls would love to see price hold above 2136.64 to increase the probability of upside continuation to ABCD targets. ABCD patterns are harmonic rotations derived from … Continue reading
Premium Members Preview: ES Emini Futures Exhales In Retracement Mode
Gallery
Remember all those days that ESH15 was in a sideways range between 2088.75 and 2121, well hopefully you do since it was just last month? This was like the market was holding its breath, which as we all know, can … Continue reading
Then & Now with Harmonic Patterns SP500
Gallery
I chose to do a video on Then & Now harmonic scenarios with SPX. As soon as the rendering of the video is complete it’ll auto post on my YouTube channel. Please subscribe to my channel to receive updates to … Continue reading
Premium Members Harmonic Trading Charts for Week of 1/19/2015
Gallery
Updated TF, NG, GC, SPX, DJA & DX charts for 1/20/15 at bottom of post. **Note ** Be aware of intraday price at one of these levels. The volume profile zones are good throughout the week, with the exception of … Continue reading

