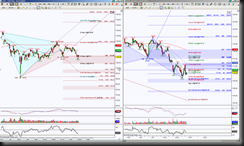
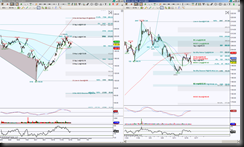
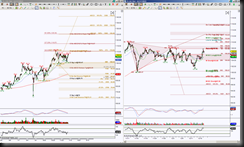
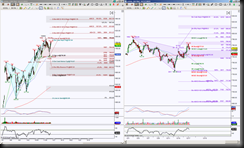
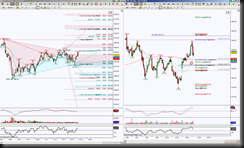
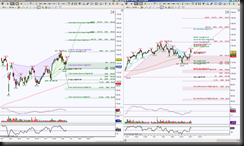
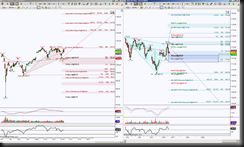
FB Day chart shows price is inside the region called PRZ (Potential Reversal Zone aka the completion zone for a harmonic pattern). This particular PRZ is between 128.95 to 136.09. It seems like a large zone, right? Well, it is … Continue reading
Tag Archives: FB
Premium Preview: IBB Be Knockin
Gallery
IBB, the ETF for biotechnology, is in overall decisive mode but knocking at levels that can help decipher bias. The Day chart shows price has been attempting to retrace the green Bullish Gartley and so far has a respectable yet … Continue reading
Premium Preview: ES_F Buyers and Sellers Tapping Their Foot
Gallery
ES_F Day chart shows price is inside a consolidation type formation as well as in between opposing emerging patterns which is also indicative of indecision, thus each side tapping their foot awaiting for price to take out important levels. Currently … Continue reading
Premium Preview: IYF Banking On Harmonic Targets
Gallery
$IYF Day chart shows price is taking out a previous high of 94.18, due to expansion there’s a suggestion of stalling or a pullback into support and the initial pullback target is 94.18 but price could come back to 91.81 … Continue reading
Premium Preview: Facebook Faces Butterfly and Shark
Gallery
FB Day chart shows price is in uptrend channel but attempting to retrace a Bearish AB=CD pattern. There’s some convergence at the bottom of the channel around 123.88 but there’s both the ideal minimum retrace target 119.49 and a Shark … Continue reading
Premium Preview: FB Face Down
Gallery
$FB Day chart shows a rollover attempt while testing the bottom of GRZ (Golden Ratio Zone aka the area between 38.2% and 61.8% Fibonacci’s) at 111.95, this being initial level to hold above or below. A hold above it has … Continue reading
Premium Harmonic Charts for the week of 01/11/2016
Gallery
I’ve added Day charts for these stocks: AAPL, AMZN, BIDU, FB, DAX_F, GOOGL, IBB GC_F Intraday chart revised and Day chart added: There are swing charts for some stocks included. Some members only trade futures, others stocks or ETF’s. It’s … Continue reading
Premium Harmonic Charts for the week of 12/21/2015
Gallery
This is a short week due to Christmas holiday. Updated intraday charts will only be posted for Monday, Tuesday & Wednesday. Enjoy your family and friends, Happy Holidays! There are swing charts for some stocks included. Some members only trade … Continue reading
Some Stock/ETF Harmonic Scenarios
Here’s some charts on AAPL, BIDU, FB, GOOGL, IBB, NFLX, QQQ. Each instrument has the Day chart perspective is on the left, the Hour chart is on the right.
Premium Harmonic Intraday Trading Charts for 12/03/2015
Gallery
When intraday levels or patterns are exceeded or invalidated, please refer to charts posted for the week, click here. Have a question about an instrument not listed? Just ask me. The stock charts posted so far this wk have … Continue reading

