I will be travelling Friday and Sunday, so the charts for next week will be posted as soon as possible upon my return home Sunday. The stock charts posted so far this wk have same harmonic scenario if there’s no … Continue reading
Tag Archives: DAX_F
Premium Harmonic Intraday Trading Charts for 10/04/2016
Gallery
I will be travelling Friday and Sunday, so the charts for next week will be posted as soon as possible upon my return home Sunday. The stock charts posted so far this wk have same harmonic scenario if there’s no … Continue reading
Premium Preview: DAX Relaxing or Relay Racing?
Gallery
DAX futures Day chart shows price has relayed through a triangular formation with the race milestone at an upside target of 13135. Price has a way to go to reach that ideal target, but the primary reason of being a … Continue reading
Premium Preview: Can DAX Wax The Floor With Harmonic Opportunity?
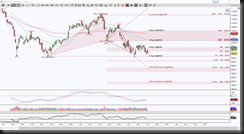
The DAX completed a harmonic pattern at 9760 offering an opportunity for buyers to step in, when they failed to do so it offers the the opportunity for sellers to push lower to extended harmonic pattern targets.
The Day chart shows rather than bouncing with conviction off the brown zone between 9760 & 9546.5, price breached below it to test a previous low of 9303.5, this I call a Significant Level and it is an important one in the world of harmonics. Below it has two ideal targets, 8723.5 and 7985.5. Either of these targets will offer another opportunity for buyers to step in for a retracement mode of a bullish pattern.
The other side of the coin, double bottoms also offer that same buying opportunity, and every buying opportunity level in the DAX needs conviction to invalidate the current bearish cross, in this case, initially above 9760 then more important above 10122.
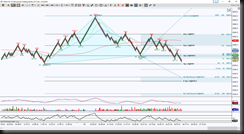
For an intraday perspective, I’m using an STRenko 20 bar chart. I’ve left the Day chart levels on this intraday chart labeled with a D. If price holds below 9387, downside ideal targets are 9232.5 which helps price test the vicinity of the Day Significant Level 9303.5, and the extended ideal target of 9243 would push price below the Day level.
If price is able to hold above the intraday Significant Level 9426.5, the initial important resistance target is 9476 which above there risks shifting the intraday bias to upside, increasing in that probability above 9631.
Trading involves substantial risk and is not suitable for all investors. Past performance is not indicative of future results.
Premium Harmonic Charts for the week of 01/11/2016
Gallery
I’ve added Day charts for these stocks: AAPL, AMZN, BIDU, FB, DAX_F, GOOGL, IBB GC_F Intraday chart revised and Day chart added: There are swing charts for some stocks included. Some members only trade futures, others stocks or ETF’s. It’s … Continue reading
Premium Harmonic Intraday Trading Charts for 01/07/2016
Gallery
I’m having some technical issues w/ some of my STHarmonic levels showing on some of my charts, if you’re having the same issue, we’re working on it. The stock charts posted so far this wk have same harmonic scenario if … Continue reading
Premium Harmonic Intraday Trading Charts for 01/06/2016
Gallery
I’m having some technical issues w/ some of my STHarmonic levels showing on some of my charts, if you’re having the same issue, we’re working on it. The stock charts posted so far this wk have same harmonic scenario if … Continue reading
Premium Harmonic Charts for the week of 01/04/2016
Gallery
Swordlines for IBB, IWM, QQQ, TF_F & YM_F have been added Intraday harmonic charts for AAPL, BIDU, FDAX have been added. There are swing charts for some stocks included. Some members only trade futures, others stocks or ETF’s. It’s not … Continue reading
Premium Harmonic Charts for the week of 12/21/2015
Gallery
This is a short week due to Christmas holiday. Updated intraday charts will only be posted for Monday, Tuesday & Wednesday. Enjoy your family and friends, Happy Holidays! There are swing charts for some stocks included. Some members only trade … Continue reading
Premium Harmonic Charts for the week of 12/14/2015
Gallery
STLevel updates for QQQ Day chart and DX_F Hour charts There are swing charts for some stocks included. Some members only trade futures, others stocks or ETF’s. It’s not meant for an individual to trade all these instruments at once, … Continue reading


