
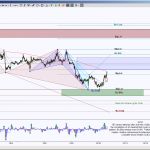
Copper Futures (HGZ13) has an opportunity to complete both opposing Harmonic Patterns. This occurs when the completion of one pattern is within the opposing patterns guidelines to remain valid. The day chart shows price is going sideways, currently holding inside 3.4285 and 3.0145, this … Continue reading
Tag Archives: Analysis
All Access Harmonic Trading Charts for 10/14/2013
Gallery
Premium Members Harmonic Trading Charts for 10/13/2013
Gallery
**Note ** Use these longer timeframe charts throughout the week, intraday charts will be posted daily. These charts are also setups for swing entries.
Premarket and End of Day Harmonic Trading Charts 10/10/13
Gallery
This gallery contains 24 photos.
The end of day charts are the preliminary harmonic analysis for globex and following day’s premarket setups
All Access Harmonic Trading Charts for 10/11/2013
Gallery
Premium Harmonic Trading Charts & Premarket Video for 10/11/2013
Gallery
Premium premarket video, click here.
Premarket and End of Day Harmonic Trading Charts 10/9/13
Gallery
This gallery contains 26 photos.
The end of day charts are the preliminary harmonic analysis for globex and following day’s premarket setups
All Access Harmonic Trading Charts for 10/10/2013
Gallery
Premium Harmonic Trading Charts & Premarket Video for 10/10/2013
Gallery
Premium premarket video, click here.
Premium Members Harmonic Trading Charts CL_F
Gallery
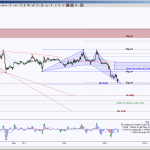
Can oil futures, CLX13, break it’s 3 month range? The Day chart showd price has recently tested 101, the lower region of the sideways range. So what is the probability that price will stay inside the range, I’m not a … Continue reading